Monitor profit and CGT figures
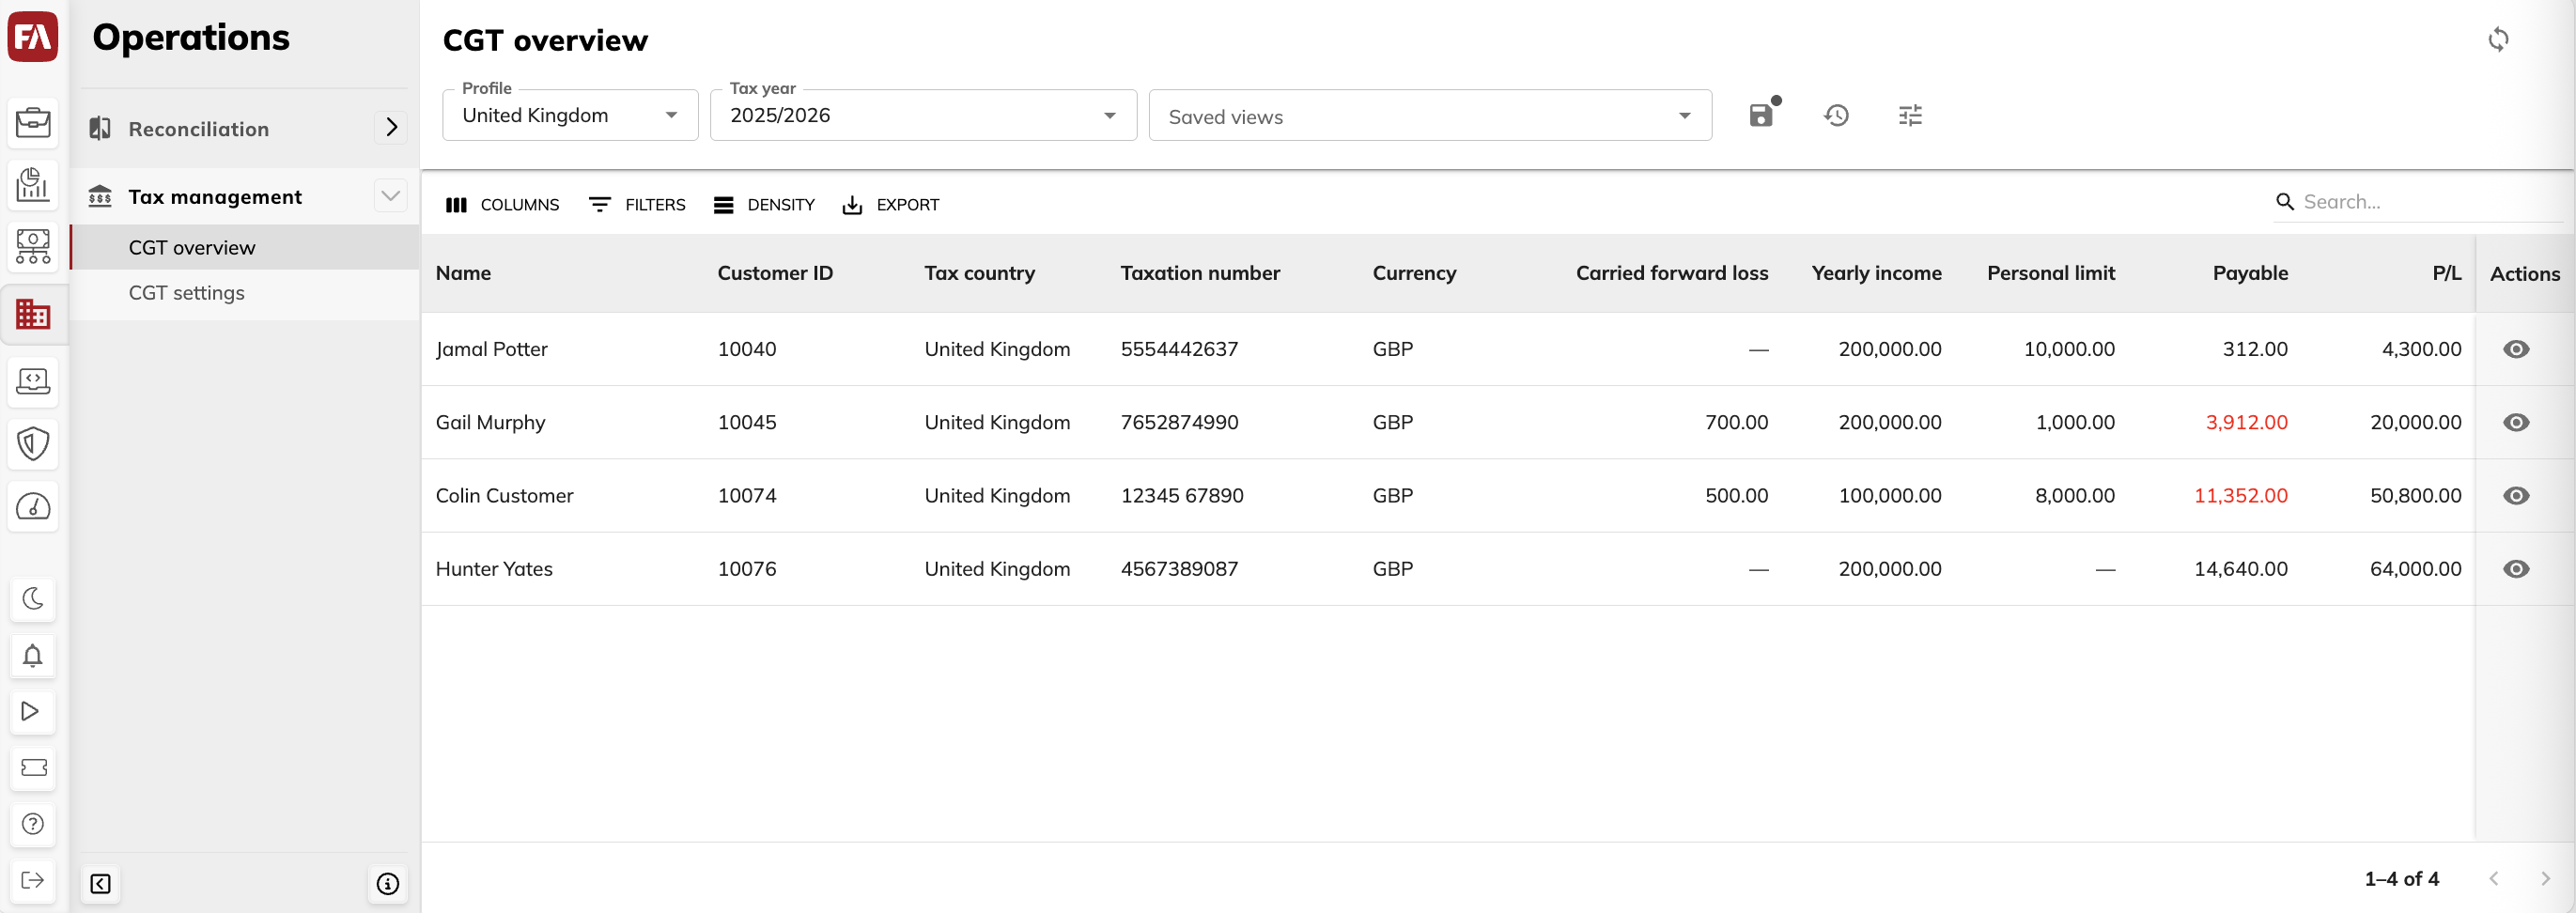
You can review the profit and CGT accumulated throughout the year per customer in the CGT overview. For more detailed figures, see the Purchase lots view.
Review CGT figures per customer
The CGT overview shows the customer's CGT information (see more about the fields in Fill in customer's information) and provides the following figures:
- Payable
The CGT amount to be paid for the customer’s current tax year. This is based on all settled and unsettled sell transactions during the tax year. The figure is red if the payable amount exceeds the customer's personal CGT limit.
- P/L
Realized profit (positive) or loss (negative) subject to CGT for the tax year. Note that the gain or loss includes only sells of CGT-applicable securities in the CGT-applicable portfolios.
 |
Adjust the view
You can adjust the table layout and specify the search criteria, and then save these modifications for later:
Make your adjustments. You can:
Adjust columns.
Show or hide columns (
 ).
).Reorder by dragging and dropping.
Change the width by dragging the boundary.
Sort by clicking the column name.
Adjust table row density (
 ).
).Filter the table based on column content (
 ).
).Search the table with the search fields at the top of the view.
Click
 and enter a name for the view.
Click Save.
The adjustments are saved as a view, including the search fields at the top. You can now:
Set a saved view as the default. The default view is applied after you reopen the app in a new browser tab. To do this, click the Saved views field or
 , and then click the star icon
  next to the saved view.
Open a saved view, work with it and make changes to it, and then use
 to restore the view to its previously saved settings.
Clear the saved view and return to the initial system view (click
 in the Saved views field).
Rename or delete saved views (click
to open the saved views sidepane).
View purchase lots
You can drill down into the specific lots that were used in the CGT calculation and see how the total CGT figures for the year were calculated:
Select the customer row in the CGT overview and click
 .
.Click View purchase lots.
Change the tax year at the top-right if needed.
You can share URL of purchase lots list because it includes contact ID and the tax year.
The Purchase lots view shows how each sale was matched with previous purchases – according to the selected valuation method – to determine the resulting gain or loss.
For example, if a customer bought 100 units at €100 and 50 units at €110 in two purchases, selling 150 units at €115 with FIFO results in two entries:
100 units (purchase value €10 000, sold value €11 500, profit €1 500).
50 units (purchase value €5 500, sold value €5 750, profit €250).
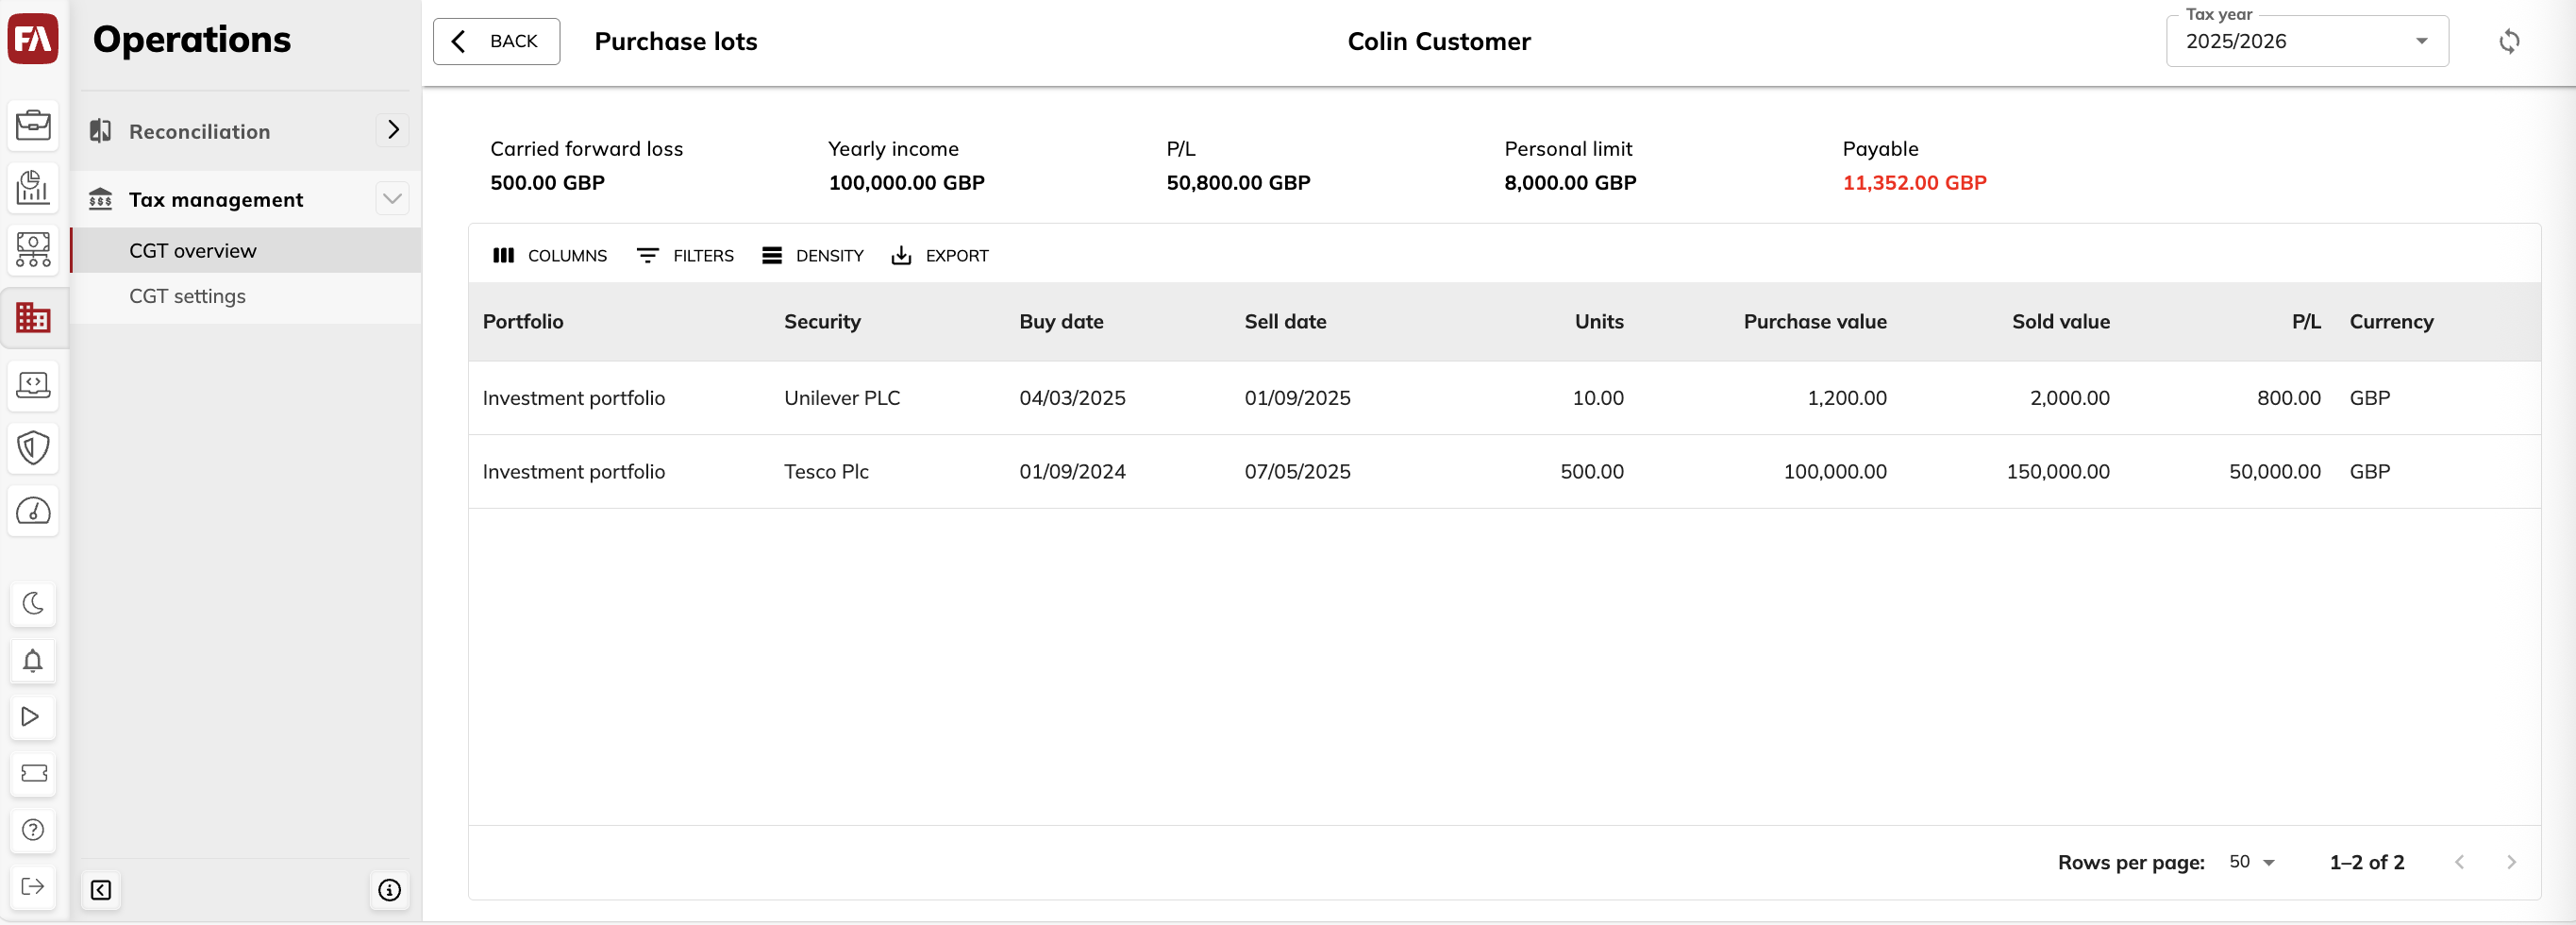 |
Purchase lots
You can view the following information:
- Portfolio
Portfolio where the asset was sold (portfolio name).
- Security
The security that was sold (security code).
- Buy date
The transaction date of the buy transaction.
- Sell date
The transaction date of the sell transaction.
- Units
The number of units sold.
- Purchase value
The purchase value of the sold units, including costs.
- Sold value
The trade amount of the sell, including costs.
- P/L
The difference between the sold value and purchase value.
- Currency
The tax currency.