Data modifications view
The Data modifications view covers all applications that modify the core data of the platform (contacts, portfolios, customers, transactions, trade orders, and so on). The first section concerns the performance statistics of rule runs. The second section concerns data operation metrics.
Rules and decision tables
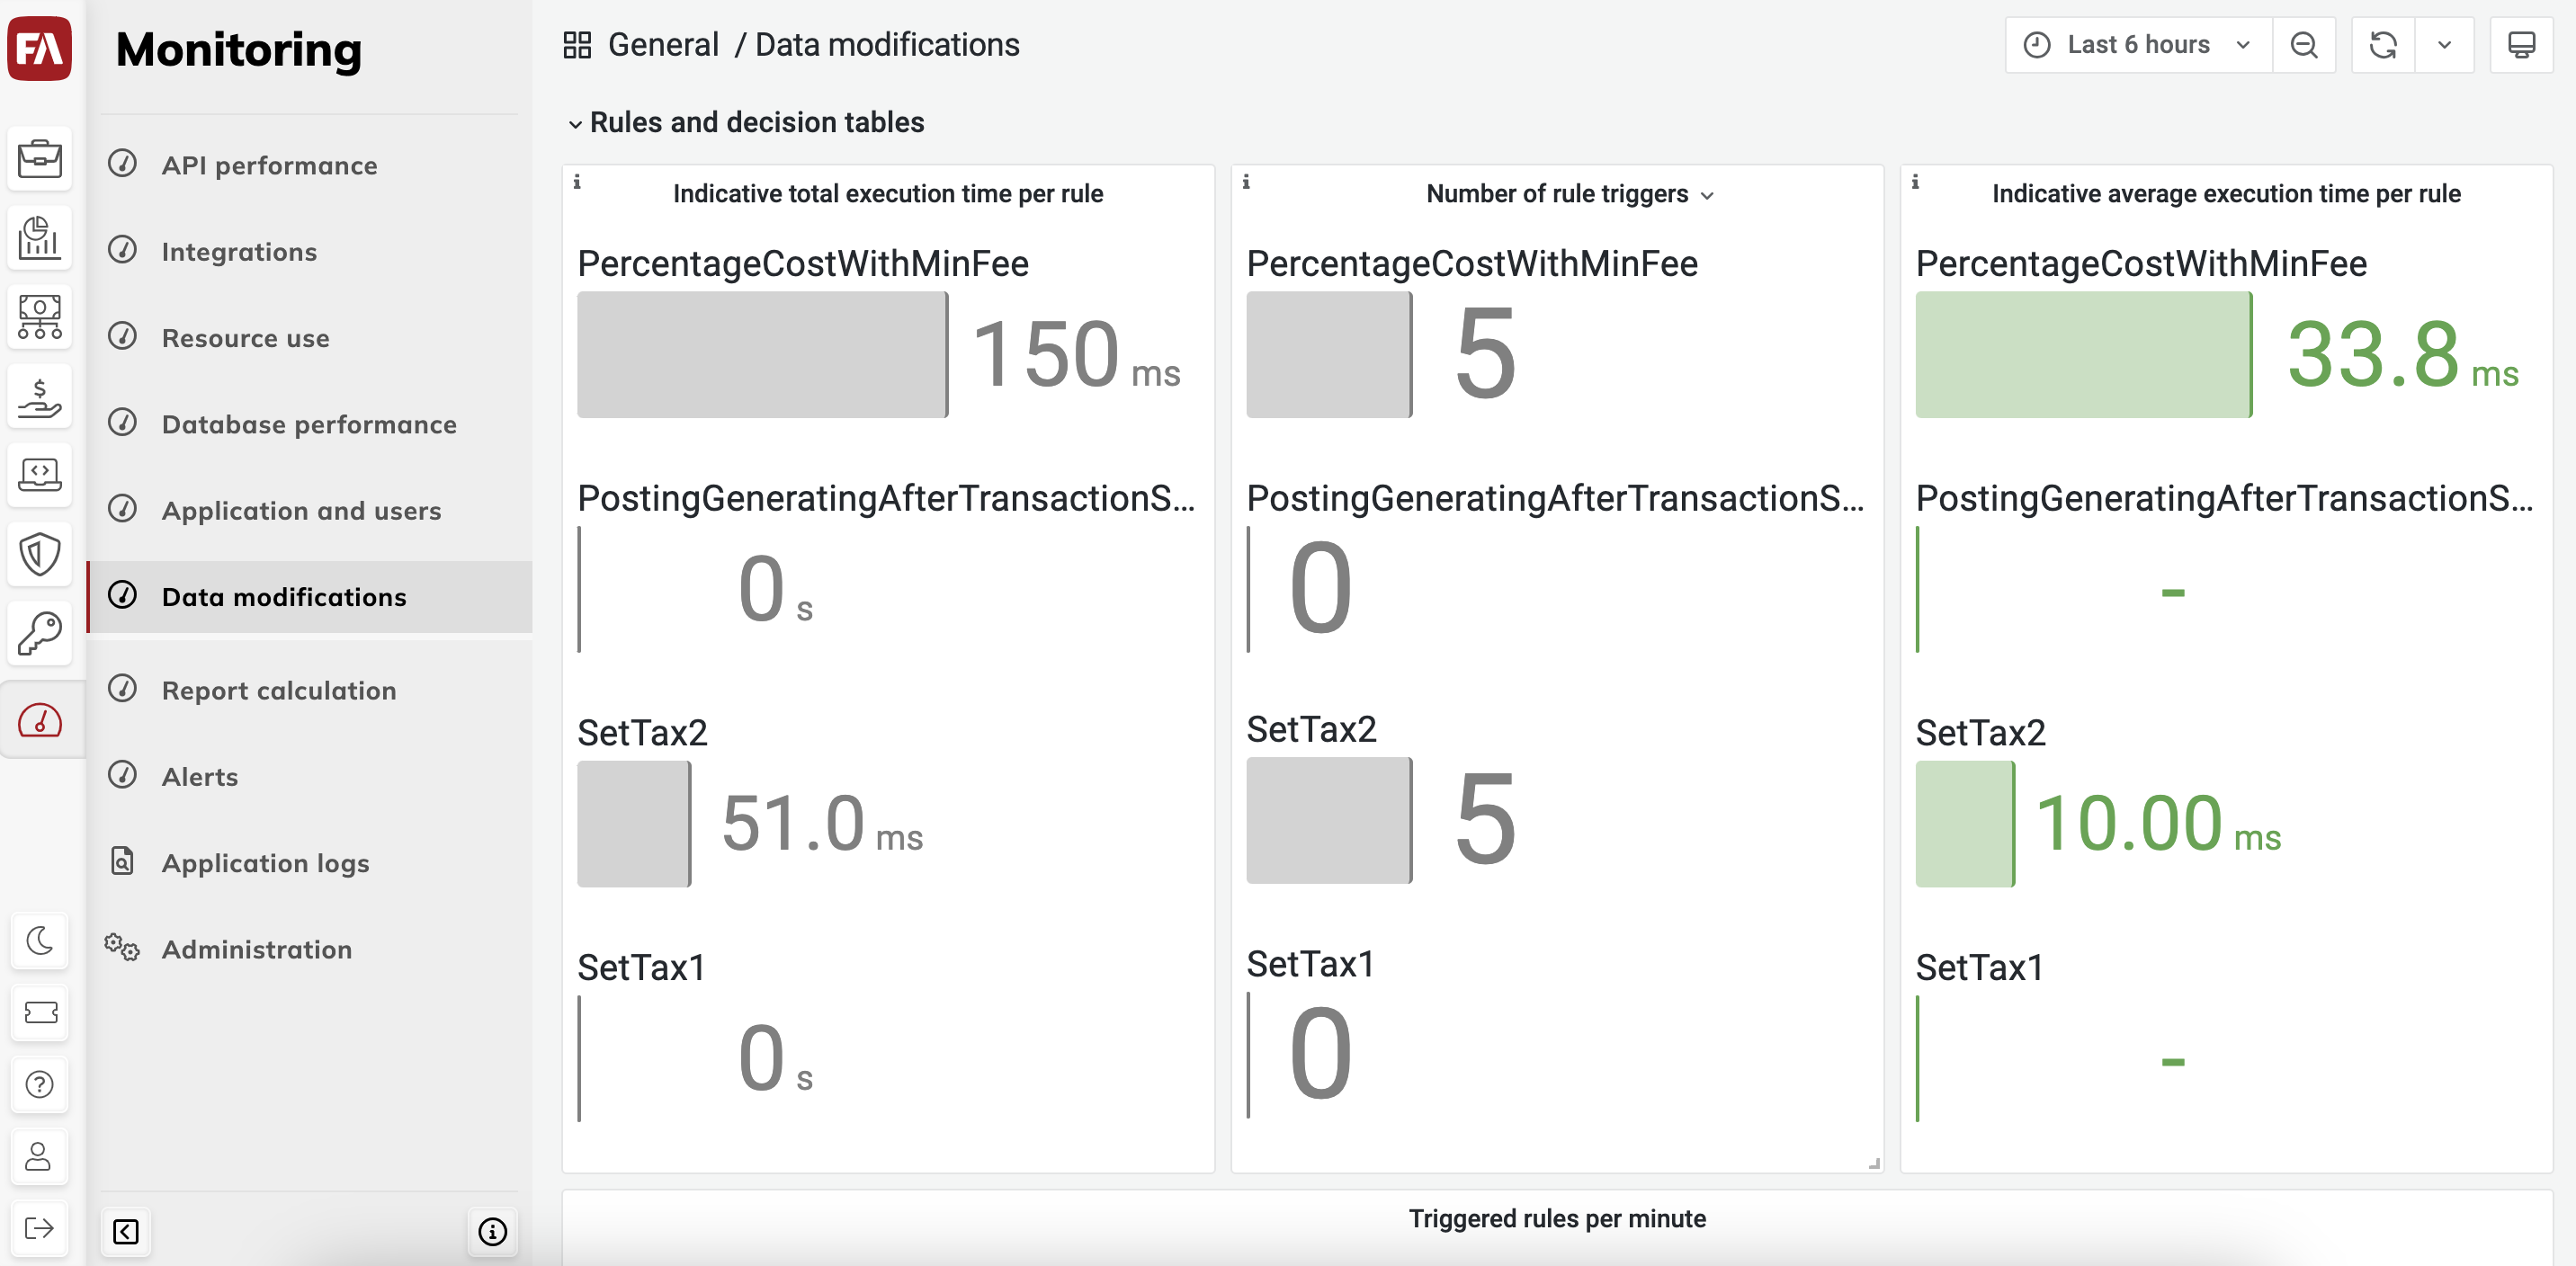 |
The charts in the Rules and decision tables section only include cases where rule conditions were met and consequences were executed. The charts describe the execution times of the consequences.
- Indicative total execution time per rule
The total execution time (in milliseconds) per rule run during the selected time period. If multiple rules or decision tables are triggered simultaneously for the same object, the total time spent on those rules is counted towards each individual rule run. For example, triggering five rules with 10 millisecond execution times for one object (contact, portfolio, security, transaction, or trade order) will result in a total execution time of 50 milliseconds for each rule.
- Number of rule triggers
The number of times a rule was triggered during the selected time period. This includes rules from decision tables and other types of rules, for example, rules generated with scripts.
- Indicative average execution time per rule
The average execution time (in milliseconds) per rule run during the selected time period. Long average execution times may indicate performance problems. If multiple rules or decision tables are triggered simultaneously for the same object (contact, portfolio, security, transaction, or trade order), the total time spent on those rules is counted towards each individual rule run. For example, five simultaneously triggered rules with 10 millisecond execution times will have average execution times of 50 milliseconds.
- Triggered rules per minute
The time at which each rule was triggered, accurate to the minute. The chart shows a more detailed analysis of the number of rule triggers and lets you analyse their distribution over the selected time period.
Note
When you view Triggered rules per minute, you might need to zoom in on the chart to see the values clearly, especially in the case of large time scales.
Data modifications
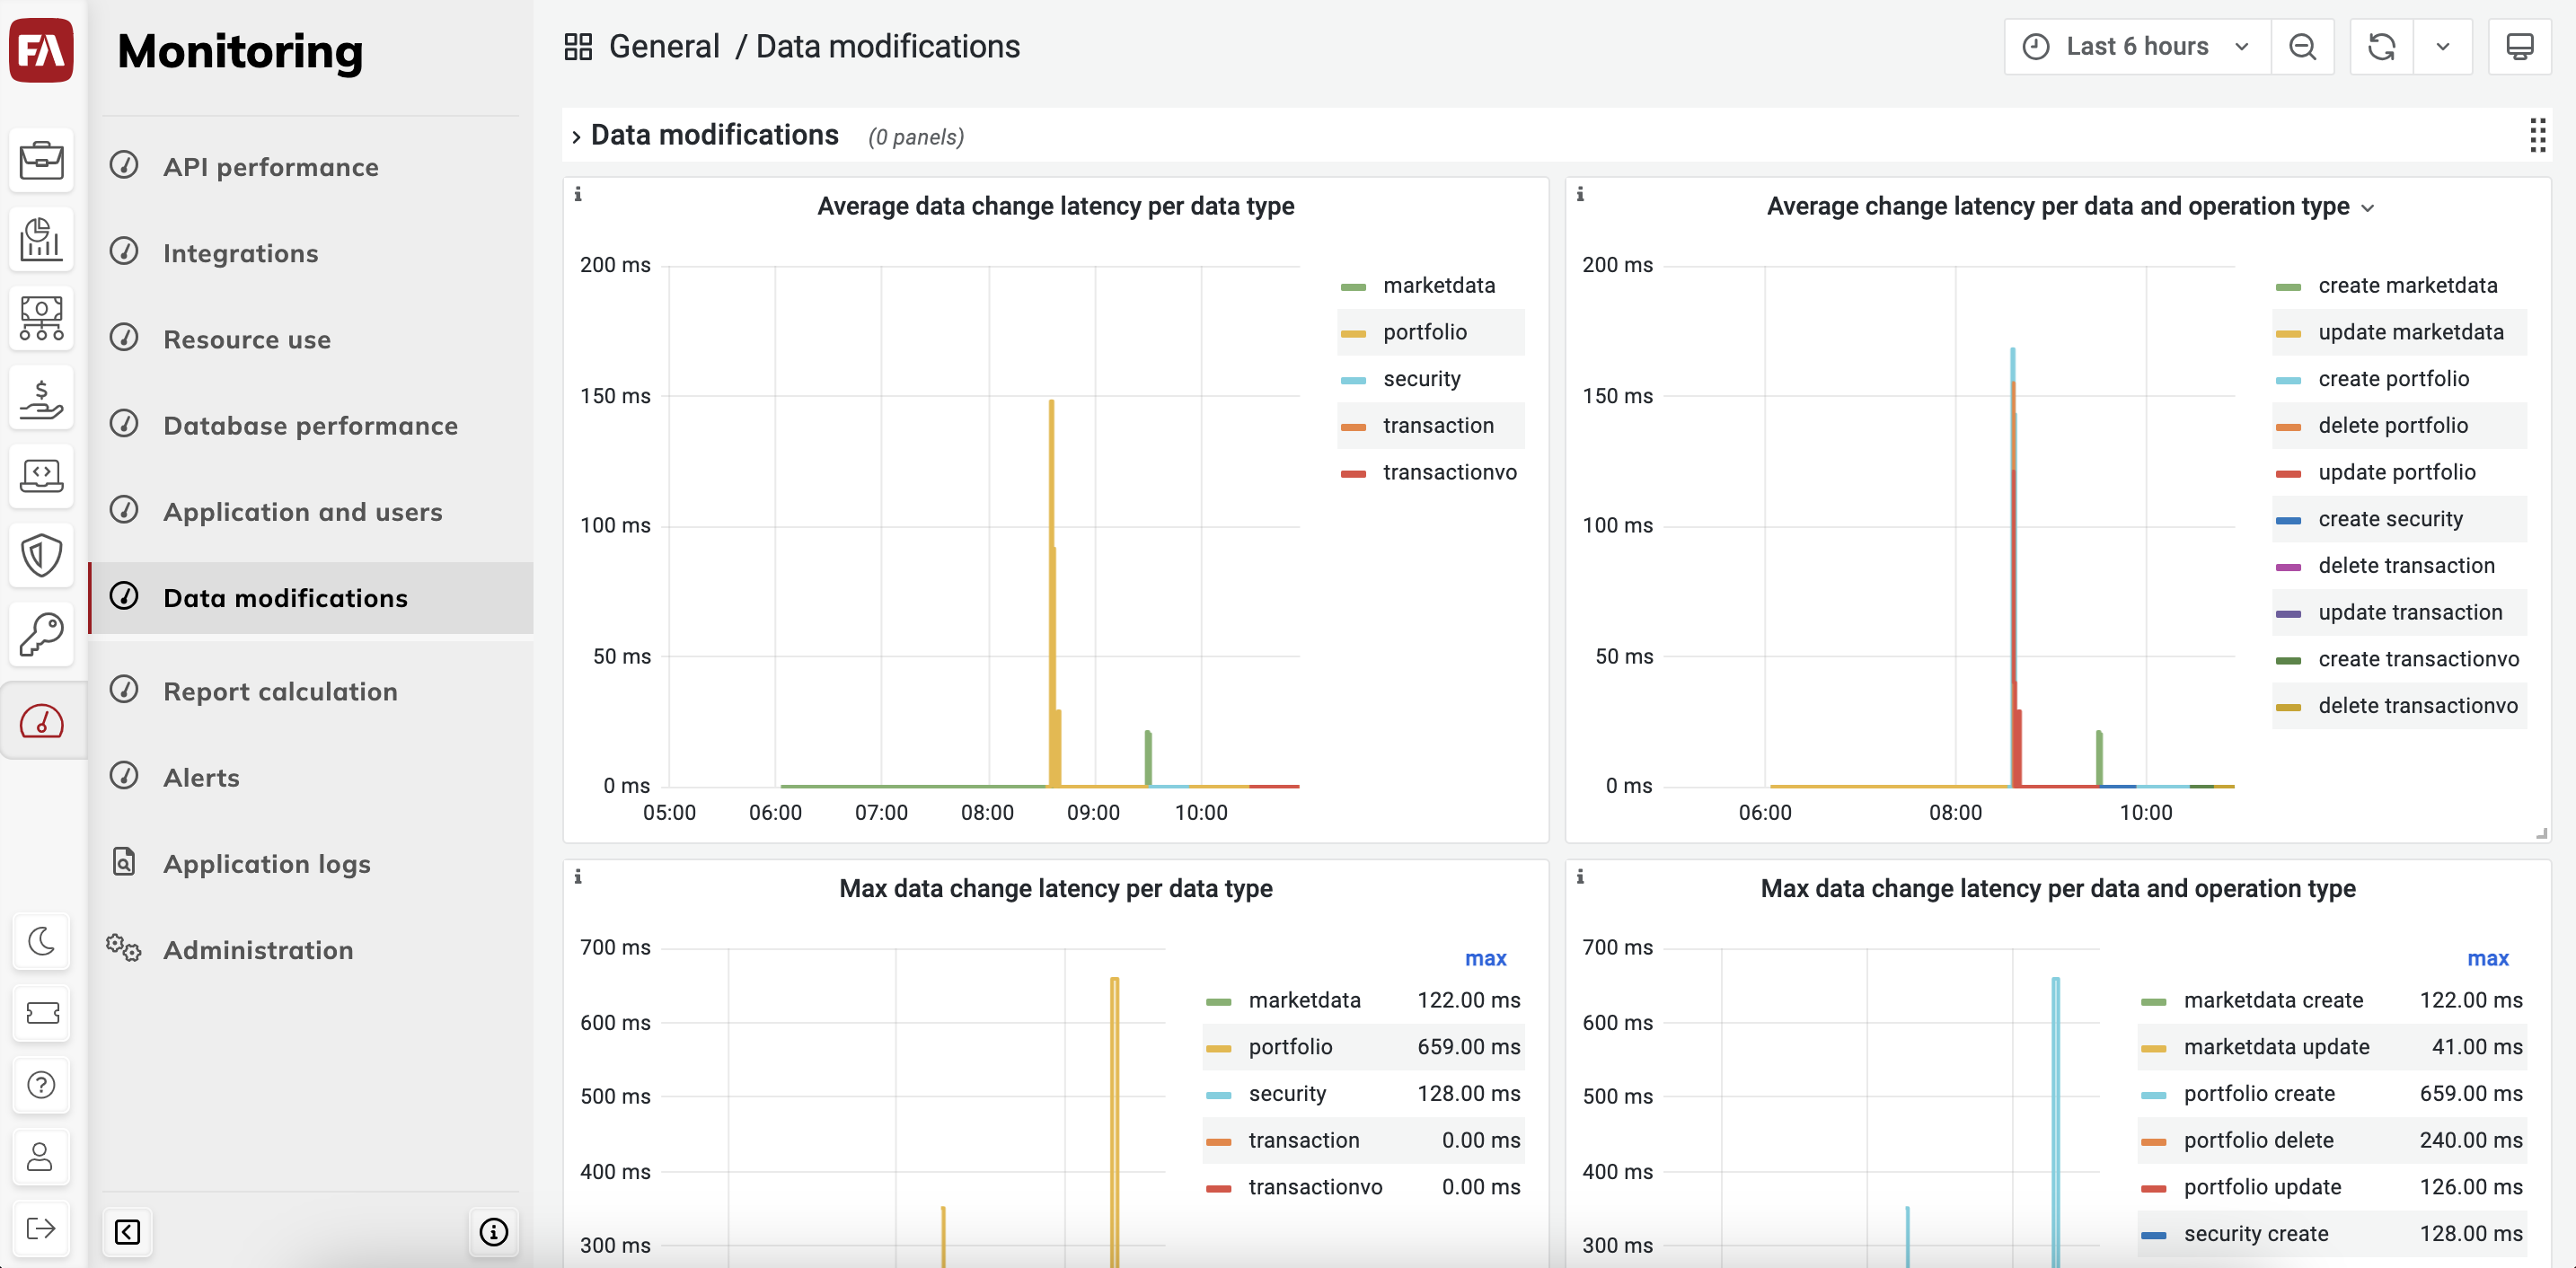 |
Except for the Database latency, all charts show the values split by:
Data type (portfolio, transaction, trade order, and so on).
Operation type (create/update/delete portfolio, security, and so on). One data operation means an addition/modification/deletion of a single data row in FA. For example, creating a new transaction in FA results in two operations: a transaction creation operation, and a separate transactionVO creation operation.
Note
As the chart lines are quite narrow, values might not show up until you zoom in a bit, especially on a bigger scale.
- Average data change latency per data type
The average time (in milliseconds) per data operation, broken down by data type. Spikes on this chart may indicate a (temporary) performance bottleneck.
- Average data change latency per data type and operation type
Same as above, broken down by data type and operation type.
- Time spent on data operations
Total amount of time spent on various data operations during a given time window (1-2 minutes), broken down per data type. Spikes on this chart indicate that extensive data modification took place at a given point in time; it does not automatically indicate slowness.
- Time spent on data operations per operation type
Same as above, broken down by data type.
- Data changes per minute
The number of objects created/modified/deleted during a given 1-minute time window. Due to technical reasons, the numbers might not be fully accurate, especially with smaller modification counts, but close to it. Spikes on this chart are not directly indicative of the performance, they indicate extensive data modification taking place.
- Data changes per minute per operation type
Same as above, broken down by operation type.
- Database latency
The database response time. The values on the chart should normally stay under 1 millisecond. Values that permanently exceed this limit indicate a potential problem in the technical setup. Spikes in these values may indicate performance problems.