About FA Monitoring app
FA Monitoring app tracks performance characteristics of FA apps and shows them on the charts. You can monitor business flows and track the technical metrics for specific aspects of the FA Platform.
You can access the following dashboards, depending on your user role:
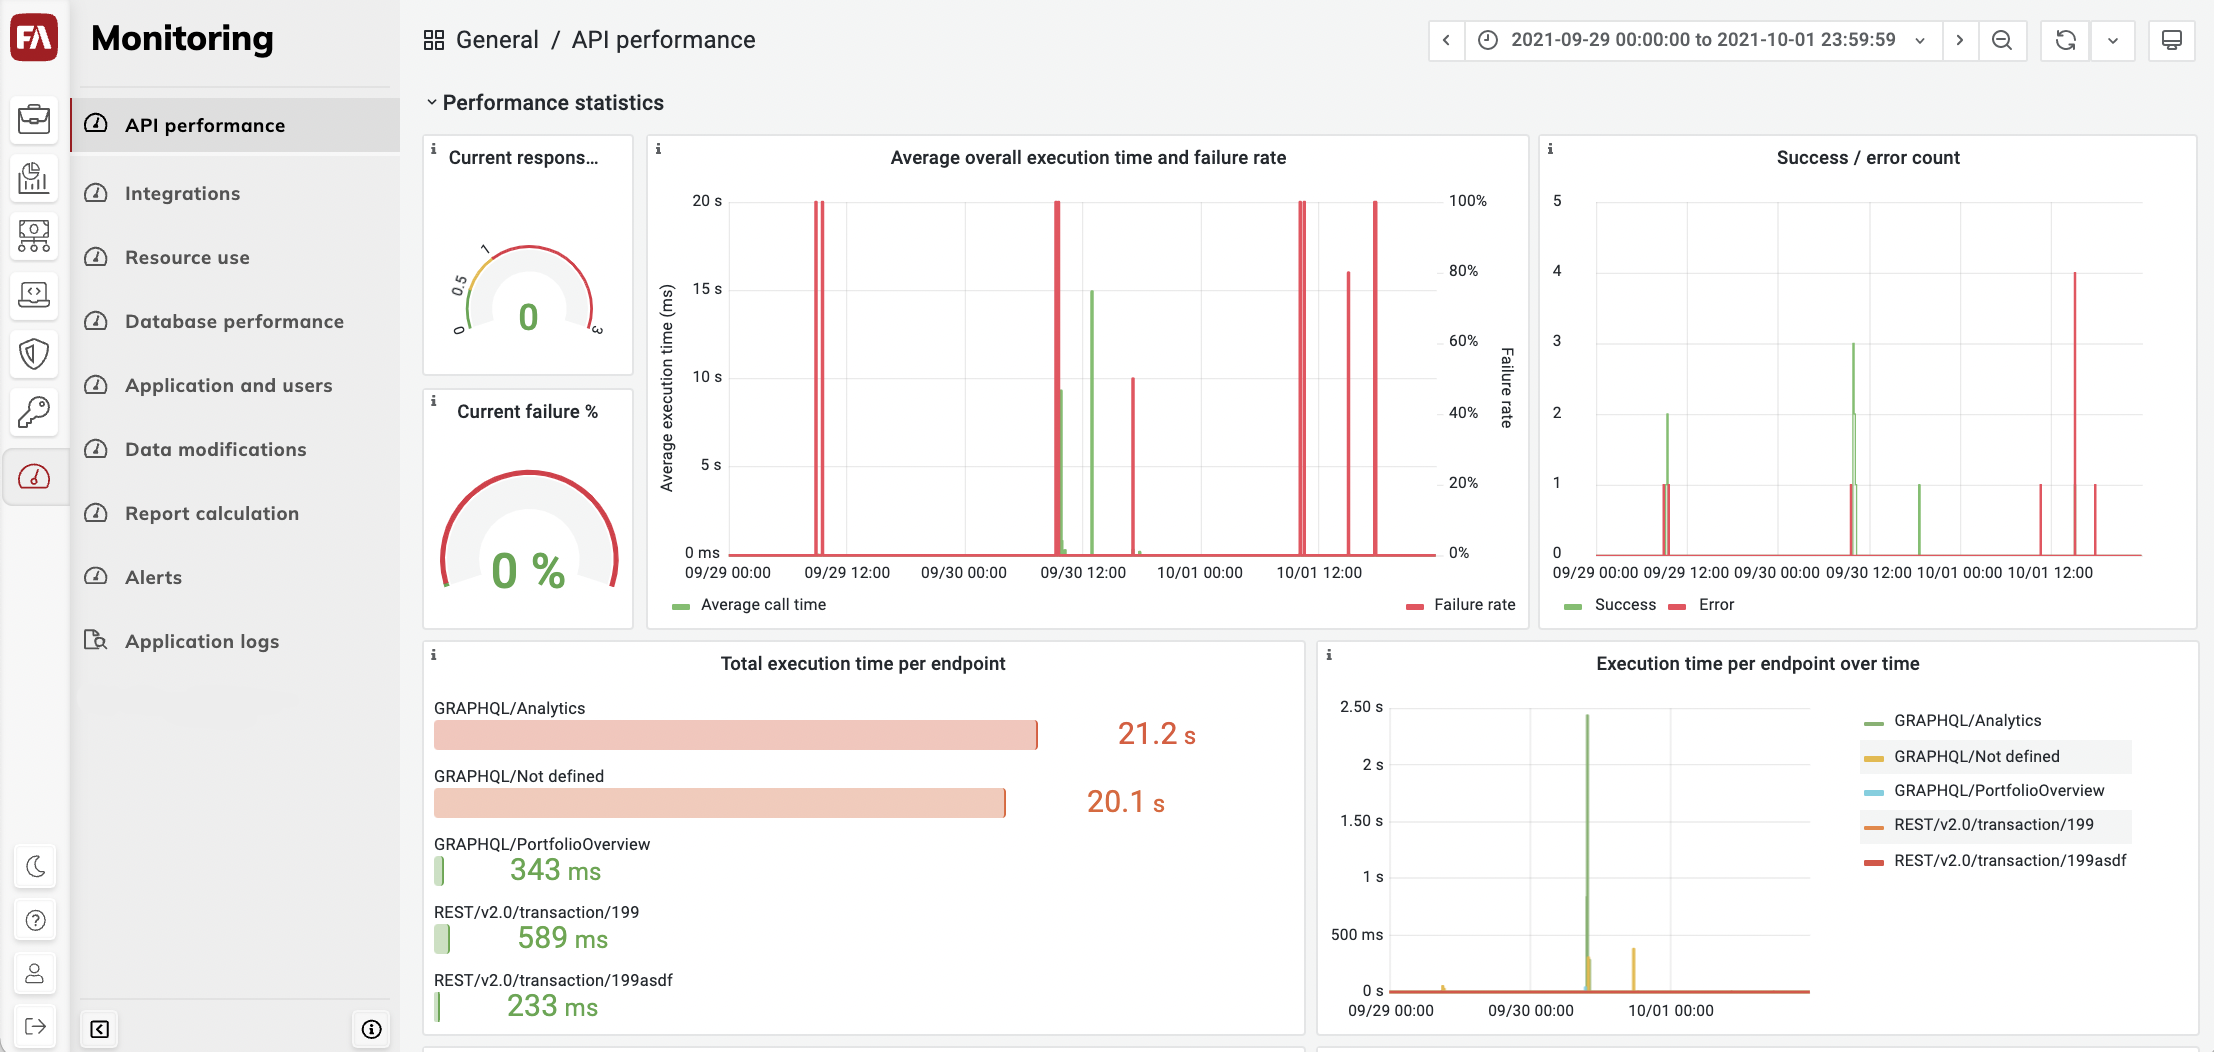
The API performance view shows statistics on API requests: request volumes, failure rates, and response times over time.
The Integrations view shows basic integration statistics for the Trading connector.
The Database performance view shows performance statistics and network traffic for the FA database.
The Application and users view shows the user activity statistics across FA applications.
The Data modifications view shows data change statistics in all applications that modify the core data of the platform (contacts, portfolios, customers, transactions, trade orders, and so on).
The Report calculation view shows statistics related to the throughput and speed of report calculation.
The Alerts view shows the charts with linked alerts that can trigger email and Slack notifications.
The Application logs view shows FA application logs.
FA Monitoring app uses Grafana to visualize metrics and logs data. To learn more about Grafana, see Grafana documentation.