Configuring Analytics columns in Preferences
You can manage your own tailored Analytics+ columns under Content and translations Preferences.
Columns based on key figures are fairly easy to add: just define a name for your column and select which key figure you want to use. Custom columns based on a formula require a bit more effort: type “analytics.” to select an existing column you want to use and embed it in your mathematical formula. In addition, you can configure how group level values are calculated (such as calculating group levels with weighted average, rounding up) and override default formatting of column values.
Changes in tailored columns and formulas are audited - user audit (system audit before FA 3.9) tracks changes users make in Analytics+ column Preferences. Every time a user makes a change to a tailored column, system audit contains a message ”User [username] created/changed/deleted Analytics+ custom column definition [code]”. These entries allow you to track whether the contents of your custom columns change. (Available from FA 3.8 onward)
When starting to create a new Analytics+ column, first define the basic column information.
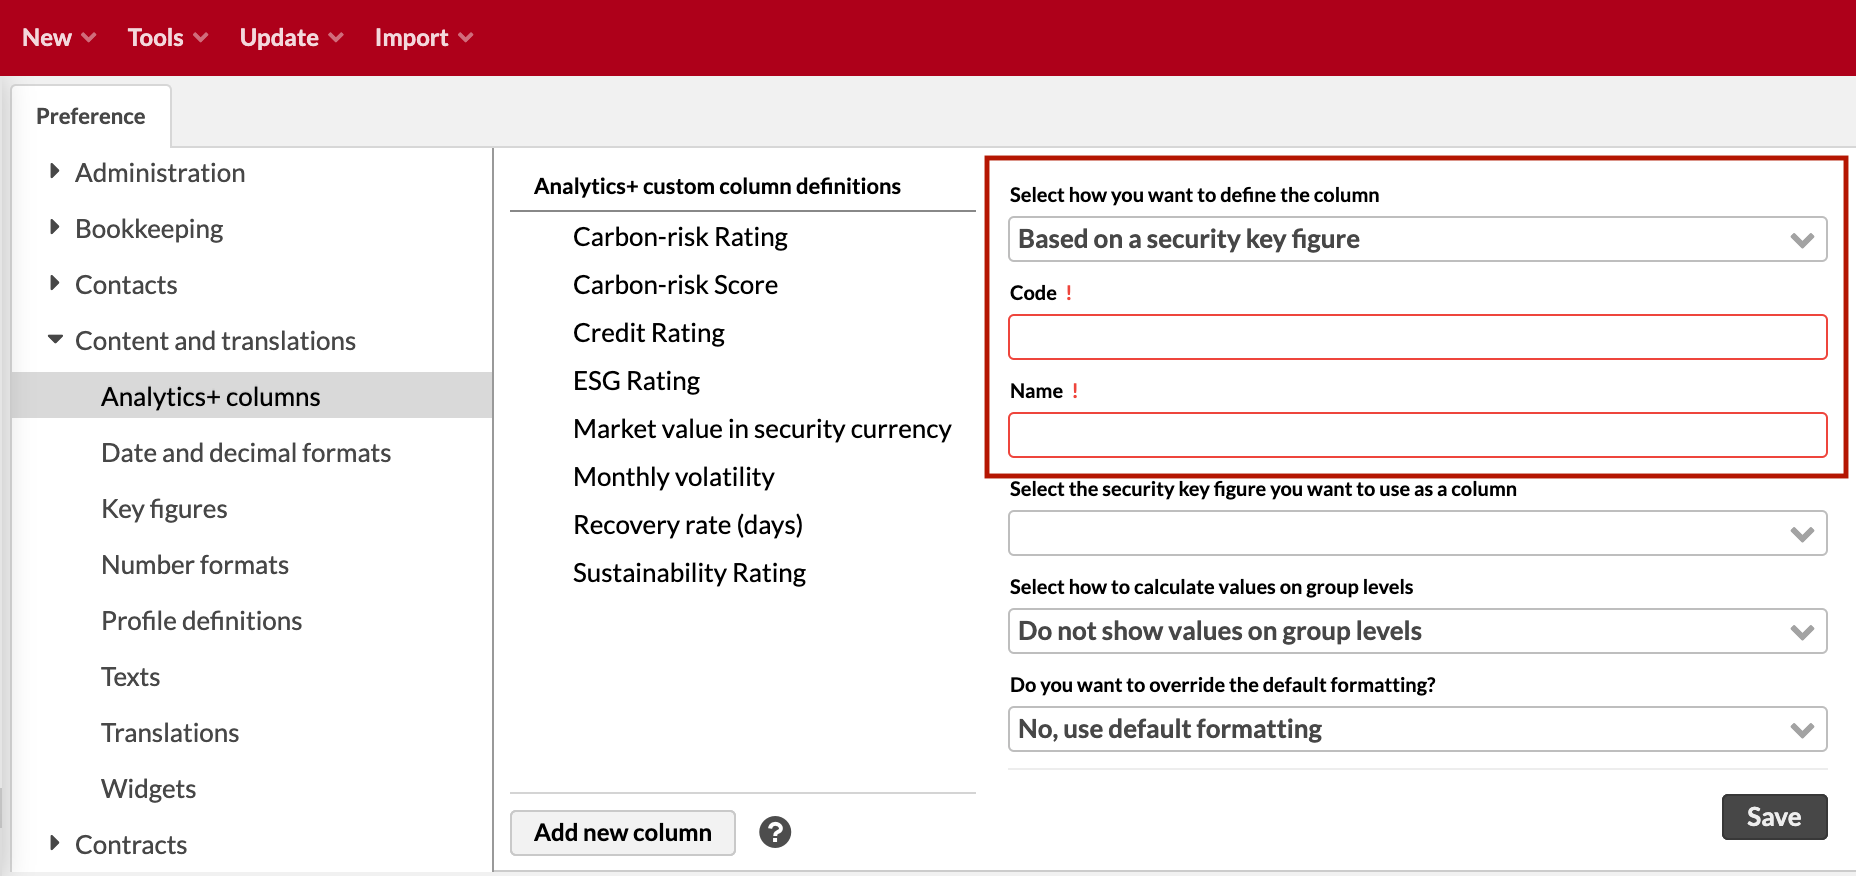
Available settings include:
- Select how you want to define the column
Select whether you want to create a tailored column Based on a security key figure or Based on a formula. This determines what kind of fields are visible for you to define your column.
- Code
Define a unique code for your column. We recommend using only alphanumeric values (i.e. letters a-z and numbers 0-9, no spaces or special characters). Column code is used to identify the column programmatically, and you cannot modify it after you save your column.
- Name
Define a name for your column. Column name is used to show the column throughout the application, for example as a column heading.
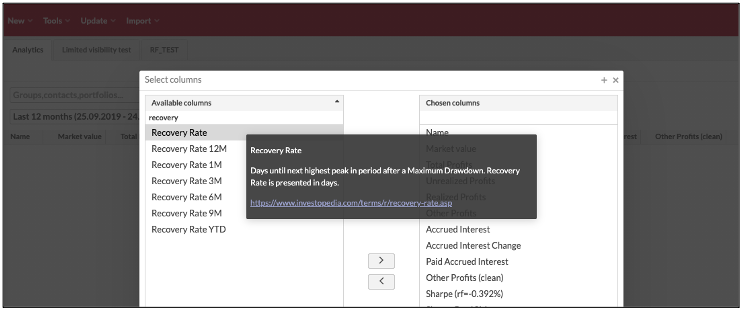
In addition to the required information, you can accompany your tailored Analytics+ columns with a description and a link, allowing you to explain the content of your column in more detail. Description and link you define in Preferences are shown in Analytics+ when you mouse-over the column when selecting columns, allowing you to more easily select the columns you need. (Available from FA 3.8 onward)
Related settings include:
- Description
Free text field to describe the content of the column, shown as text when selecting columns in Analytics+.
- Link
Provide a link for more information on the column, shown as a link when selecting columns in Analytics+.
Depending on how you selected to define the column, you either have an option to select the key figure you want to use in your column, or define the formula for your column.
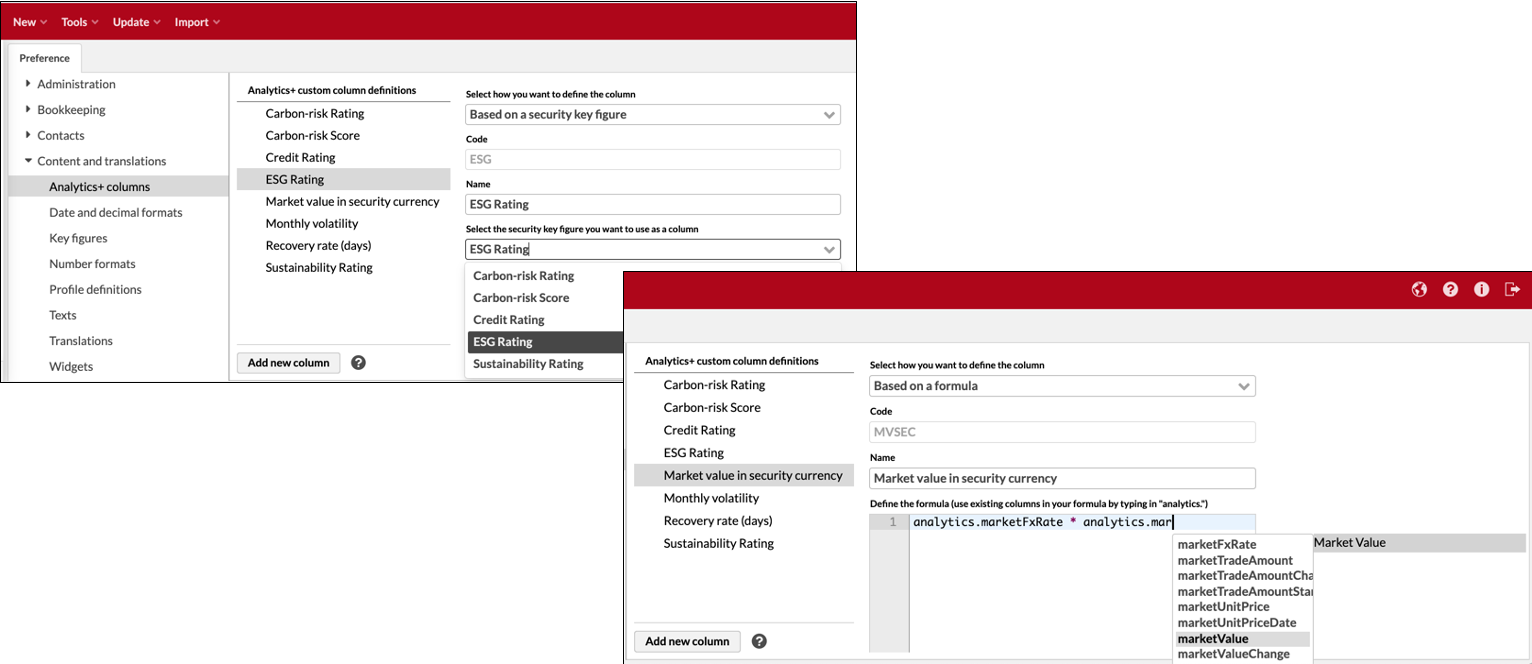
Your options are either to:
- Select the security key figure you want to use as a column
When you are creating a column based on a key figure, just select the security key figure you want to use as a column. The dropdown lists all security key figures you have defined in Key figure Preferences for securities.
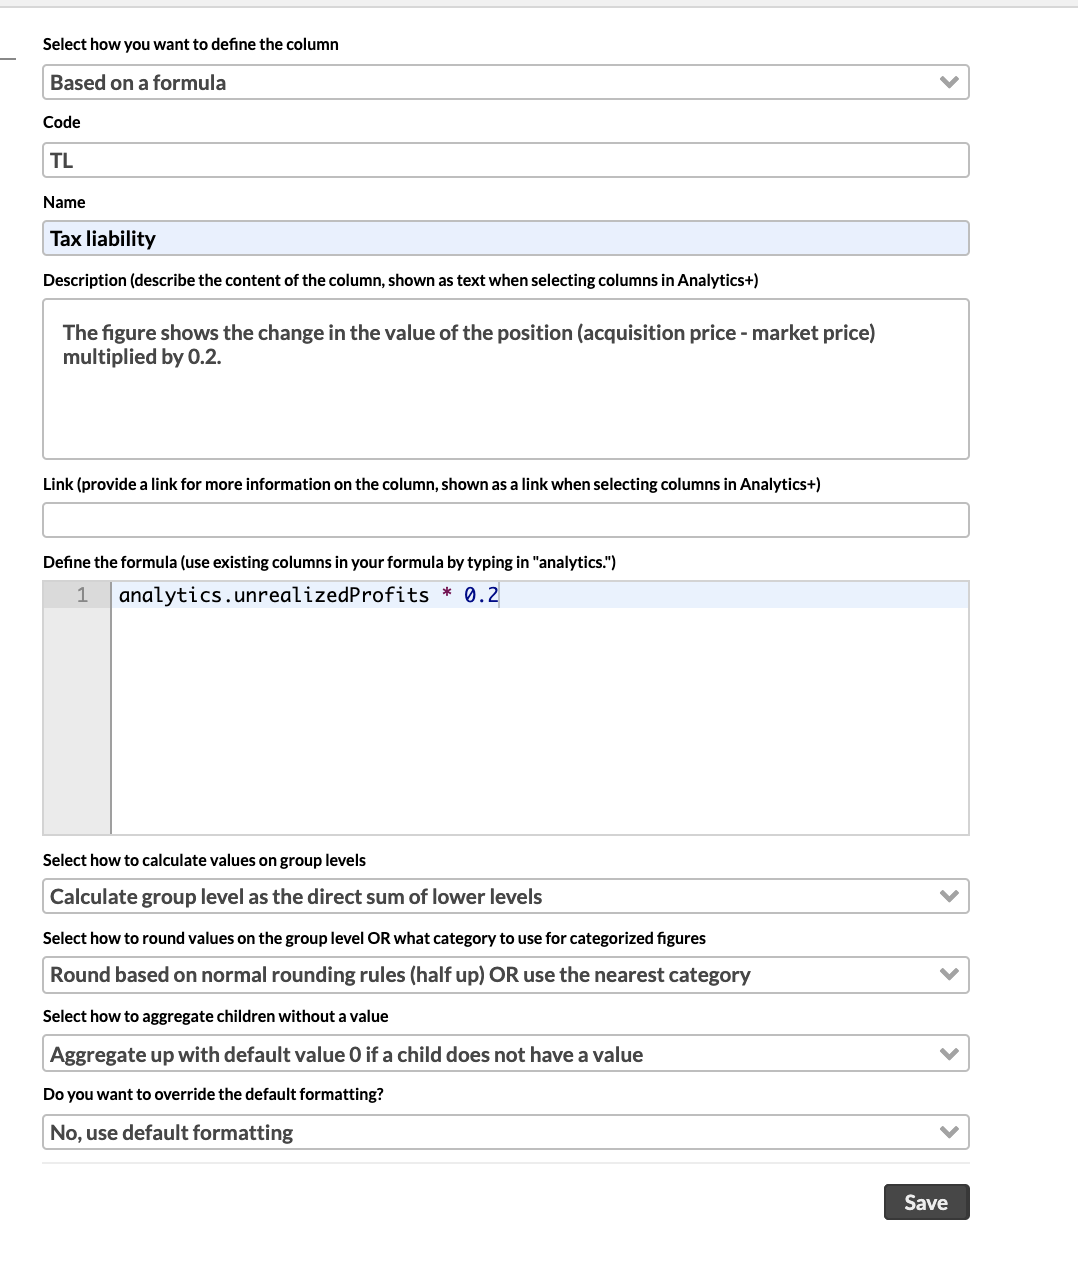
- Define the formula
When you are creating a column based on formula, define your formula within the available area. Your formula will be evaluated when you save it, and only valid formulas are saved. In case your formula is invalid, you will be prompted with details on what in your formula fails. Formula editor provides you with different options to define your formula:
Use existing Analytics+ columns in your formula. Type in "analytics." in the formula editor, and the system will provide you with a list of existing Analytics+ columns to choose from. Columns are listed with their codes (which the formula expects), but you can see the column name in the description on the right to help you identify the column you are looking for. You can use the existing columns in mathematical calculations, for example to sum, multiply and divide existing column values to derive new columns.
Use certain security details in your formula. Type in "security." in the formula editor, and the system will provide you with a list of security details to choose from. Security-related columns are listed with their codes (which the formula expects). Not all Security fields are bound into Analytics+. You can use security details just to show them in Analytics+, or to use them as part of your calculations.
Program a more complex formula. In addition, you can use Groovy or Java to program more complex formulas, and for example to use the indexed return data the whole analysis is based on as input to your formula. If you are interested in more complex formulas, contact FA for assistance.
After you have defined the content for your column, you can decide whether and how your column is calculated on the group level. By default, your own Analytics+ columns are only calculated for the security level (e.g. shown only for individual positions), but with the following settings you can tell to the system how your columns should be calculated on the group level (e.g. if you have grouped you analysis "By type", how should the column value be calculated on the security type level).
Whether to calculate values on group levels depends on your column's content: for example, "Market value in security currency" doesn't make sense when calculated on group levels (you might otherwise end up summing up market value in different currencies), whereas different ratings can be calculated on group levels as weighted average (and for example, you might want to always round risk-related ratings up for a conservative take on your analysis).
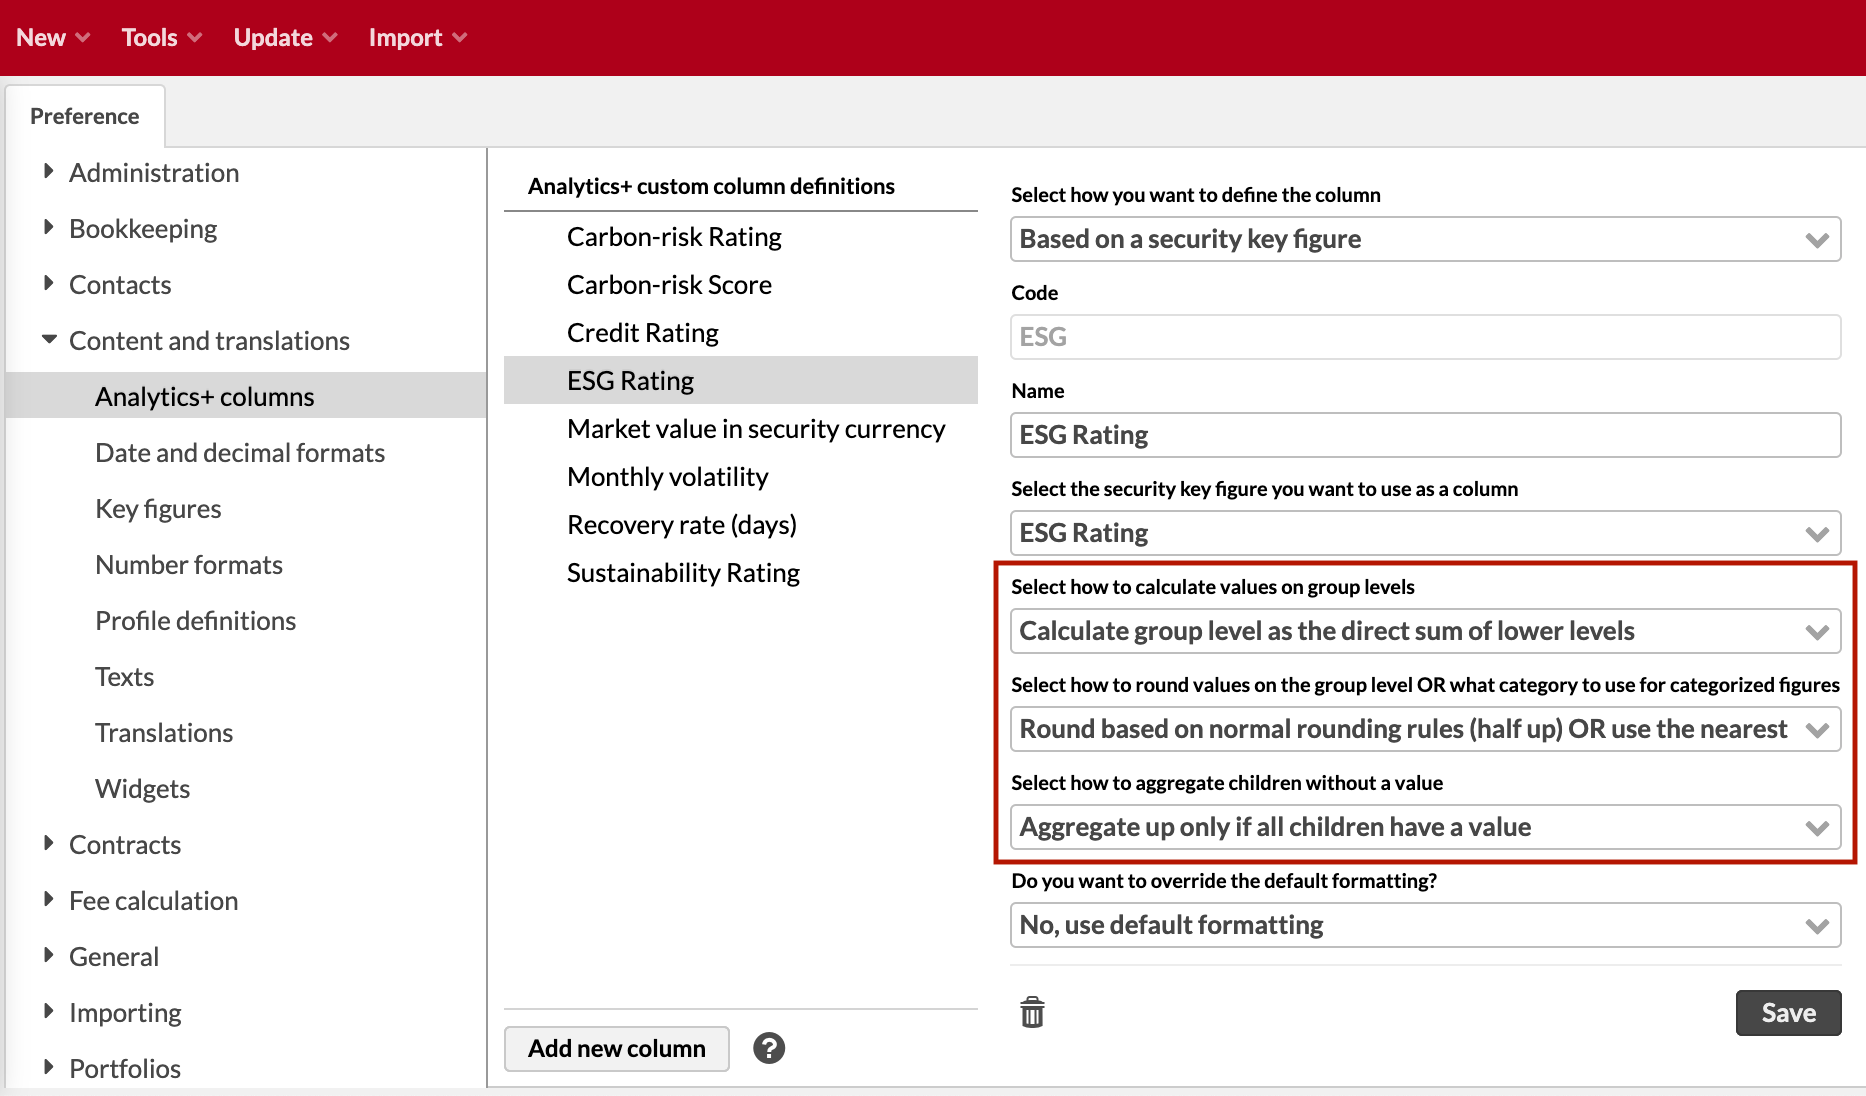
Use the following settings to control how the system should calculate values on the group levels:
- Select how to calculate values on group levels
You have different options to determine whether and how values are calculated on group levels. Consider the options carefully in order to find the best option for your column and the content you show with it.
Do not show values on group levels (default). Column values are shown only on individual positions on the position level, and not calculated to any group level. For such columns, the group level is shown as empty.
Calculate group level as the direct sum of lower levels. Group levels are calculated as a sum of the levels below it, i.e. any numerical column value from a "child" level will be summed up to the "parent" level. All group levels are simply the sum of the values from levels below.
Calculate group level as the weighted average of lower levels. Group levels are calculated as a weighted average of the levels below it, i.e. any numerical column value from a "child" level is weighted and summed up to the "paren"t level, using corresponding "share of parent" as the weight. The weighted average is calculated with the value in the "Share of parent" column.
Calculate group level as the weighted average using the absolute value of the weights. Same as above but using the absolute value of the weight. This means that negative positions will have a positive weight.
Apply formula also on group level. Only relevant if you are defining a column based on a formula. This applies the formula on the group level instead of calculating group level values from values on the lower levels. For example, you have a formula that sums up two column's values (x + y). If you select to calculate the group level from lower levels, this would mean the system calculates x + y on all your position, and then sums those up to the group level (e.g. security type level value is the sum from all positions' x + y values). However, if you apply formula on group level, it will take the x and y values directly as they have been calculated for the group level, and use those group level values to calculate x + y. Difference is whether you first calculate x + y on all positions and then sum those up, or whether you first calculate x and y on your group level, and then sum those group level figures up.
- Select how to round values on the group level OR what category to use for categorized figures
When working with numerical column values (if your column returns an integer or if you have a categorized key figure associated with a numeric value for calculations) and you have selected one of the "Calculate group level as..." options from above, you can control how rounding is handled. You can choose between "normal rounding rules", "always round up" or "always round down" - consider which rounding is most relevant for your column.
Round based on normal rounding rules (half up) OR use the nearest category. Rounds values according to normal rounding rules, using half up. For example, 1.51 (everything greater or equal to 1.5) will be rounded to 2 if your column value is an integer, or to B (2) if you have a categorized key figure with options 1=A, 2=B.
Always round up OR use the nearest bigger category. Always rounds up to the next closest value. For example, 1.21 (everything greater than 1) will be rounded to 2 if your column value is an integer, or to B (2) if you have a categorized key figure with options 1=A, 2=B.
Always round down OR use the nearest smaller category. Always rounds down to the next closest value.For example, 1.71 (everything less than 2) will be rounded to 1 if your column value is an integer, or to A (1) if you have a categorized key figure with options 1=A, 2=B.
- Select how to aggregate children without a value
Allows you to control how to manage levels without a value when you have selected one of the "Calculate group level as..." options from above. That is, how you want to calculate a group level value in for your column if one of your positions is missing the value you are showing.
Aggregate up only if all children have a value. Group level values are not calculated if any "child" on the lower level is missing a value.
Aggregate up with default value 0 if a child doesn't have a value. Group level values are calculated assuming 0 for any missing value, and using that in the group level calculation.
Finally, you can override the default formatting of your column if needed. By default, the system determines a default formatting for your column based on the key figure you are using, or the Analytics+ columns you are using in your formula. However, you might want to change how many decimals are shown, you might want to format your value as a percentage, or you might want to apply a date formatting to dates.
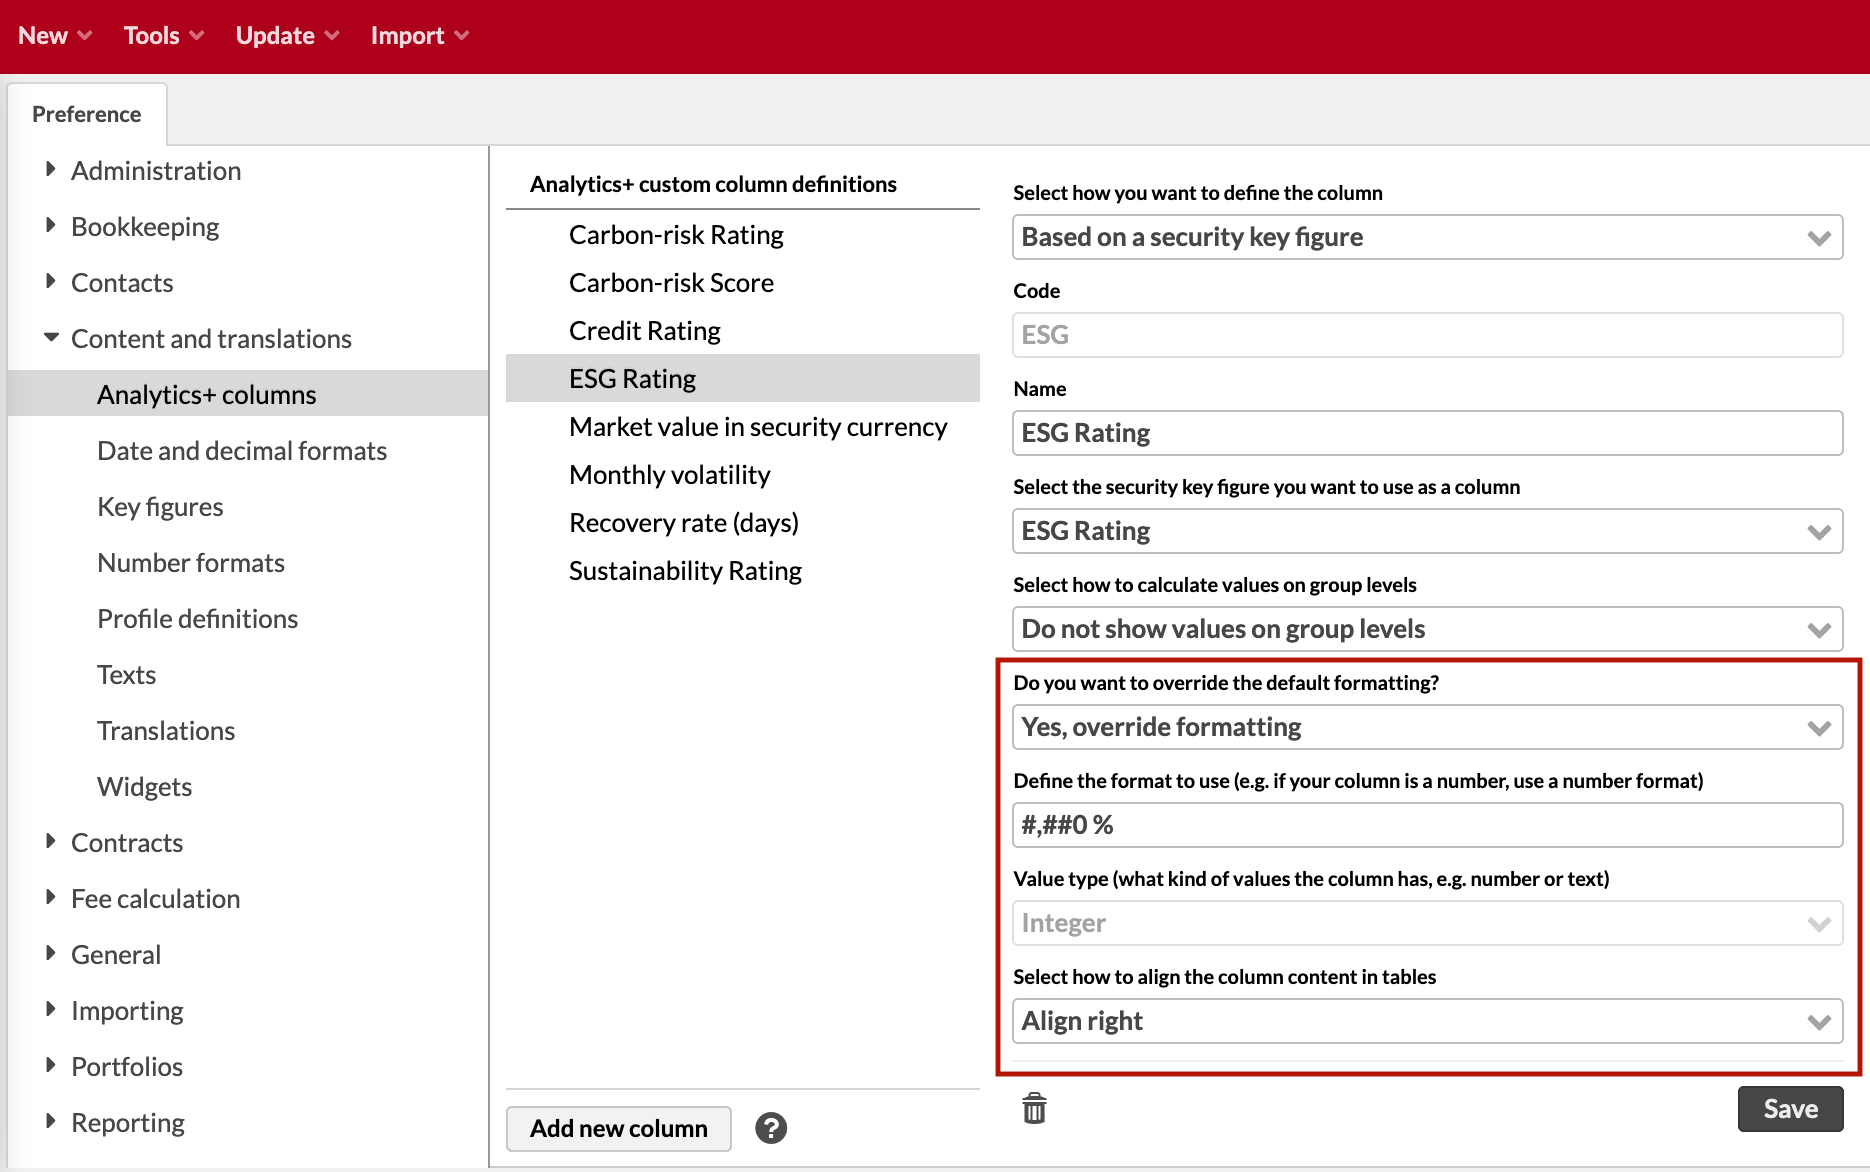
Use the following settings to override formatting:
- Do you want to override the default formatting?
Select from No, use default formatting and Yes, override formatting. If you chose to override the default formatting, more fields appear for you to define the format. It is recommended to use default formatting when possible, and only override formatting if there is a valid need to override the default.
- Define the format to use
Allows you to define the format the system should use to format your column's values. Define the formatting according to the type of your column - if your column is a number, use a relevant number format, or if you column is a date, use a relevant date format. Define the format the same way as in Date and decimal formats Preferences. For example, you can use "#,##0" never to show any decimals, or "#,##0.00" to always show two decimals.
- Value type
Indicates what type of a figure your column returns. You cannot change this, but it is automatically determined by the system. This is especially useful when overriding the formatting: this type indicates whether you are overriding a number formatting or for example a date formatting. You can also use this column to check the output of your formula. For columns based on key figures, this field tells you the key figure type.
- Select how to align the column content in tables
Allows you to select between Align right and Align left. By default, columns with type string are aligned left, and column with other types (i.e. numbers and dates) are aligned right - you can use this column to override this behavior.
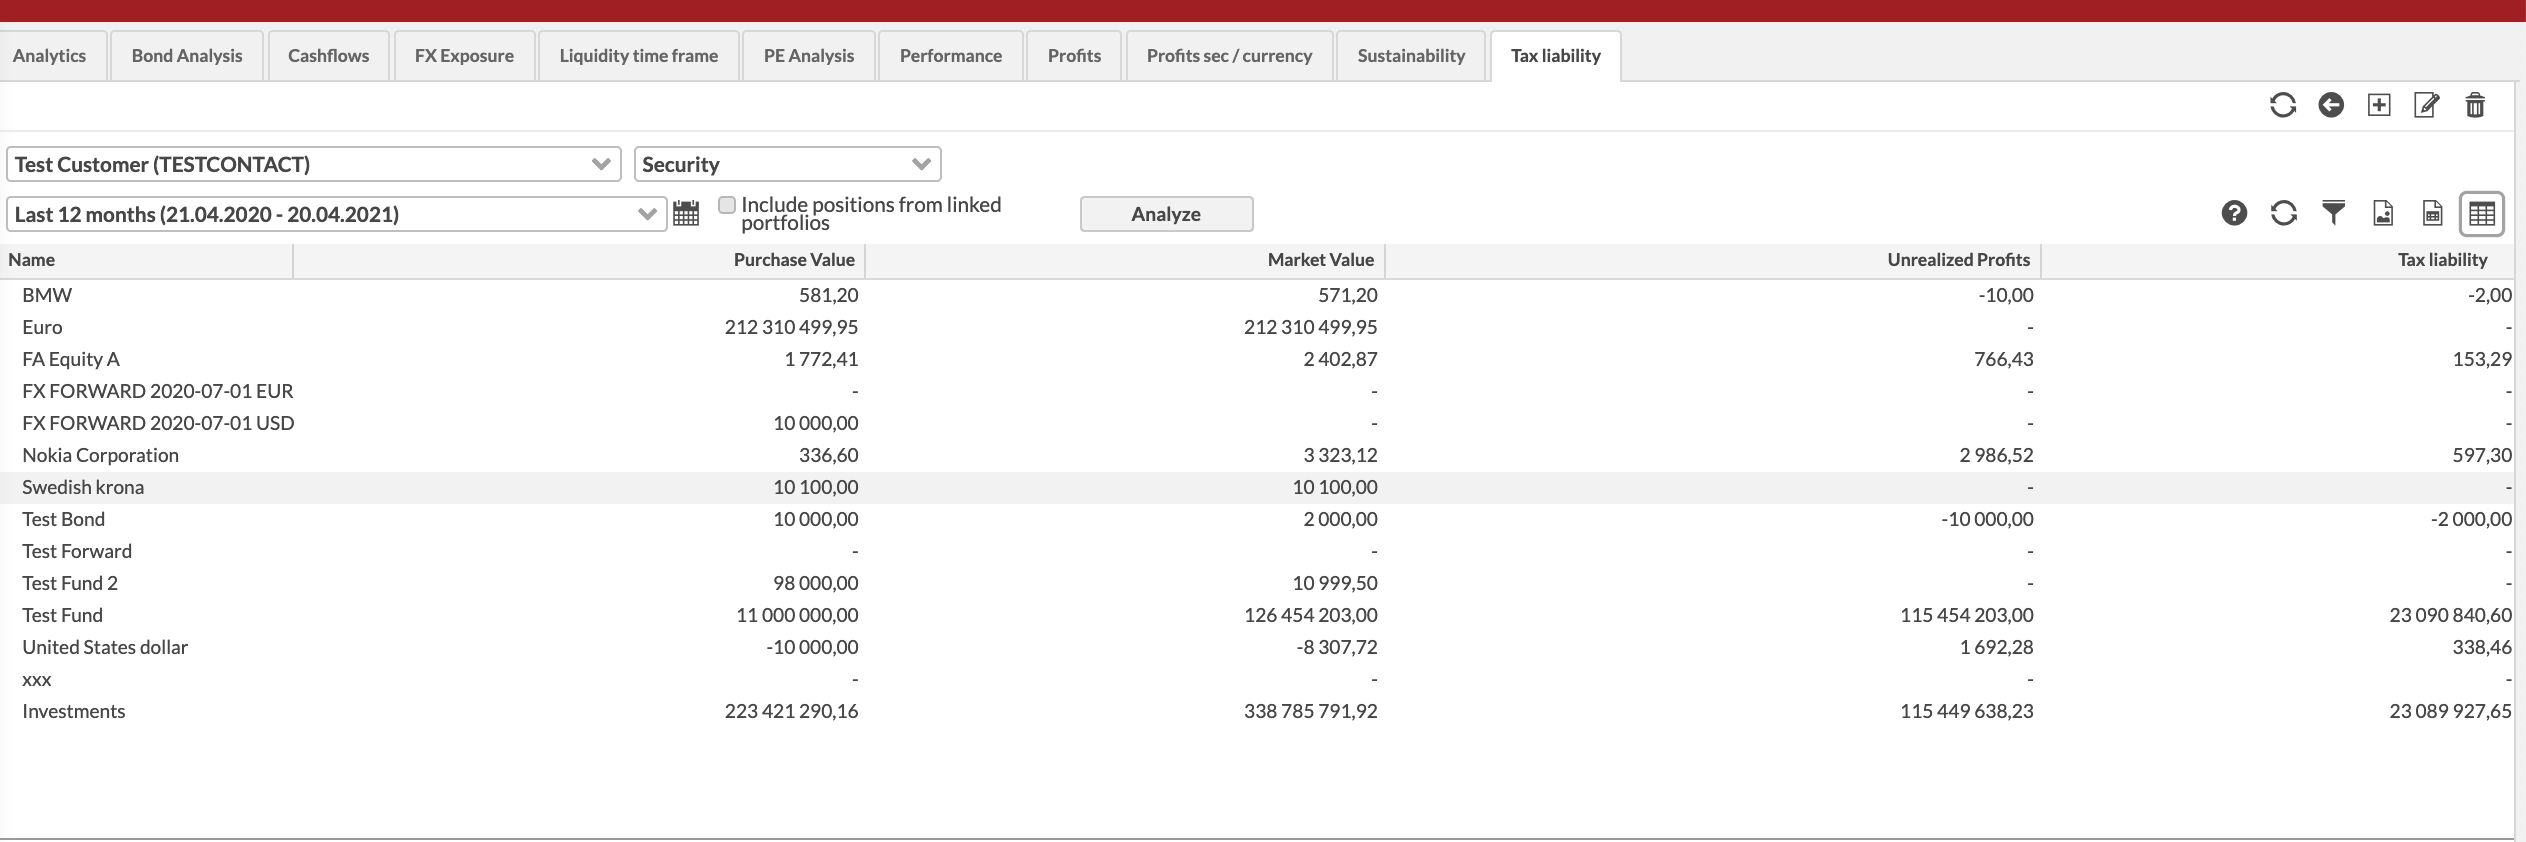
This example shows how to add a custom column that shows tax liability based on unrealized profit and fixed tax percent (20%).
Define the formula.
Create an Analytics+ view with the relevant columns.