API performance view
The API performance view shows metrics and logs related to API calls directed to FA Platform, both REST and GraphQL. These API calls may originate from within the FA platform itself (for example, PDF report generation often involves API calls), or from external systems.
Note that some API calls might not appear on the carts. To verify individual calls, refer to API call logs.
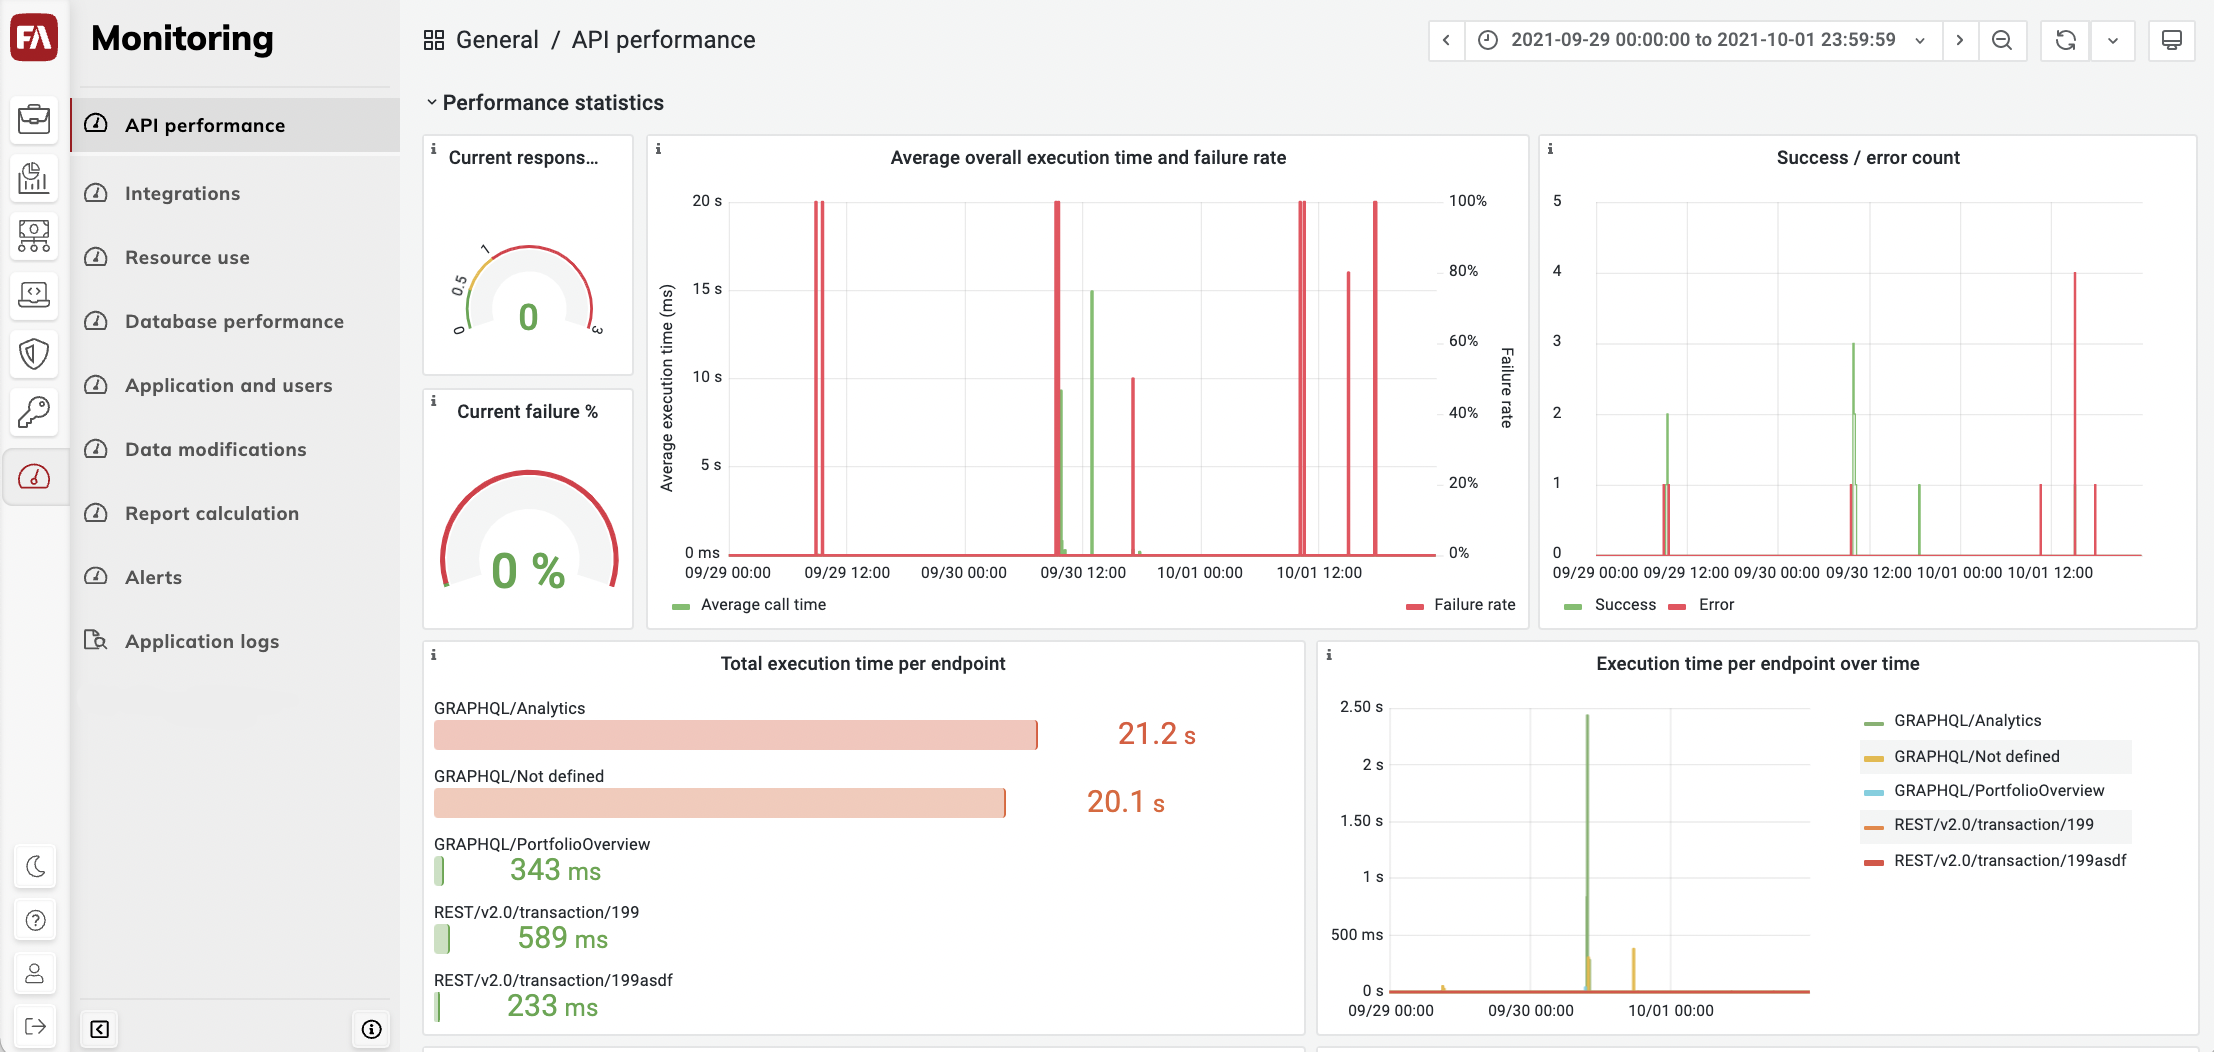
Performance statistics for all API calls
The top charts show metrics for all API calls. They provide a quick indication of whether APIs return error responses:
- Current response time
Average response time for all API calls in the last 5 minutes.
- Current failure %
The average failure rate for all API calls in the last 5 minutes.
- Average overall execution time and failure rate
Average execution time and failure rate in all API calls during two-minute windows.
- Success/ error count
The number of successful and failed API calls across all endpoints during two-minute windows.
Performance statistics per endpoint
The following charts show metrics per API endpoint:
- Total execution time per endpoint
Total execution time per endpoint during the selected time window.
- Execution time per endpoint over time
Total execution time per endpoint during a two-minute window.
- Number of calls per endpoint
Total number of API calls per endpoint during the selected time interval.
- Success/ error count per endpoint over time
The number of successful and failed API calls per endpoint during two-minute windows.
API logs
API logs are the most reliable way to determine if a specific API call occurred. Other charts may omit API calls in certain situations, but the API logs should show each API call.
- Success/ error logs
The number of success/ error log entries across all endpoints for the selected time interval.
- Call logs
Click to expand the log entry and view the details.