Drill-down into underlying positions in Analytics Plus
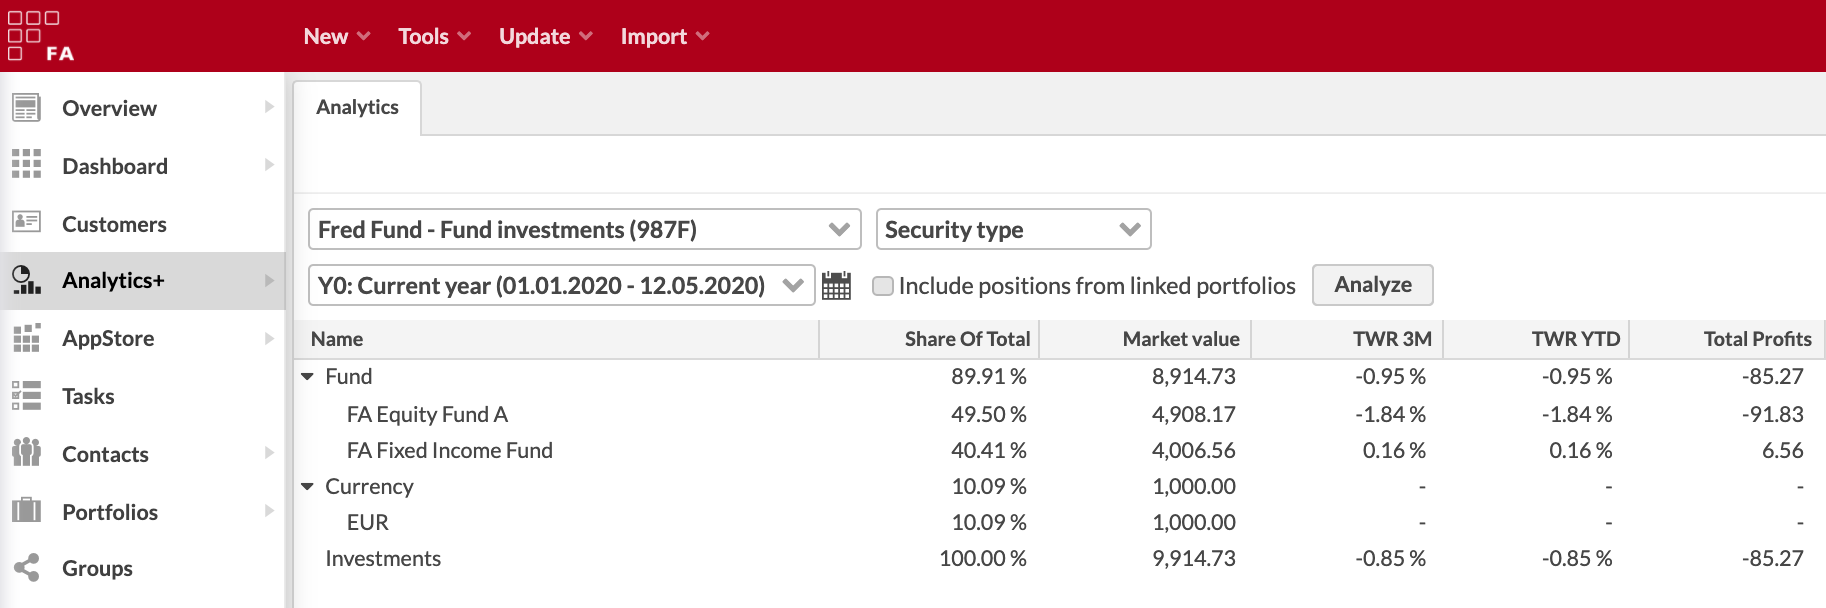
Analytics + provides you with tools to drill down or "look through" into the contents of a position’s linked portfolio, allowing you to see the underlying positions you own through your investment. Instead of only seeing the position your portfolio directly contains, you can look deeper into your investments. For example, you can drill down to see the contents of your fund when you maintain the fund portfolio in FA, or to see your underlying investments in a shared ownership structure - starting point for the drill down can look like something in the picture below.
Analytics+ provides you two options for drill down: you can either only include underlying positions in your analysis, when your actual positions are replaced with the underlying positions, or you can also visualize the drill down hierarchy, when your underlying positions are shown in a tree structure under your actual positions.
Include underlying positions in your analysis
Include positions from linked portfolios option fetches positions from portfolios linked to your portfolio's positions, and replaces your position with the underlying investments in your analysis. As a result, instead of a fund position, your analysis would show the positions from your fund.
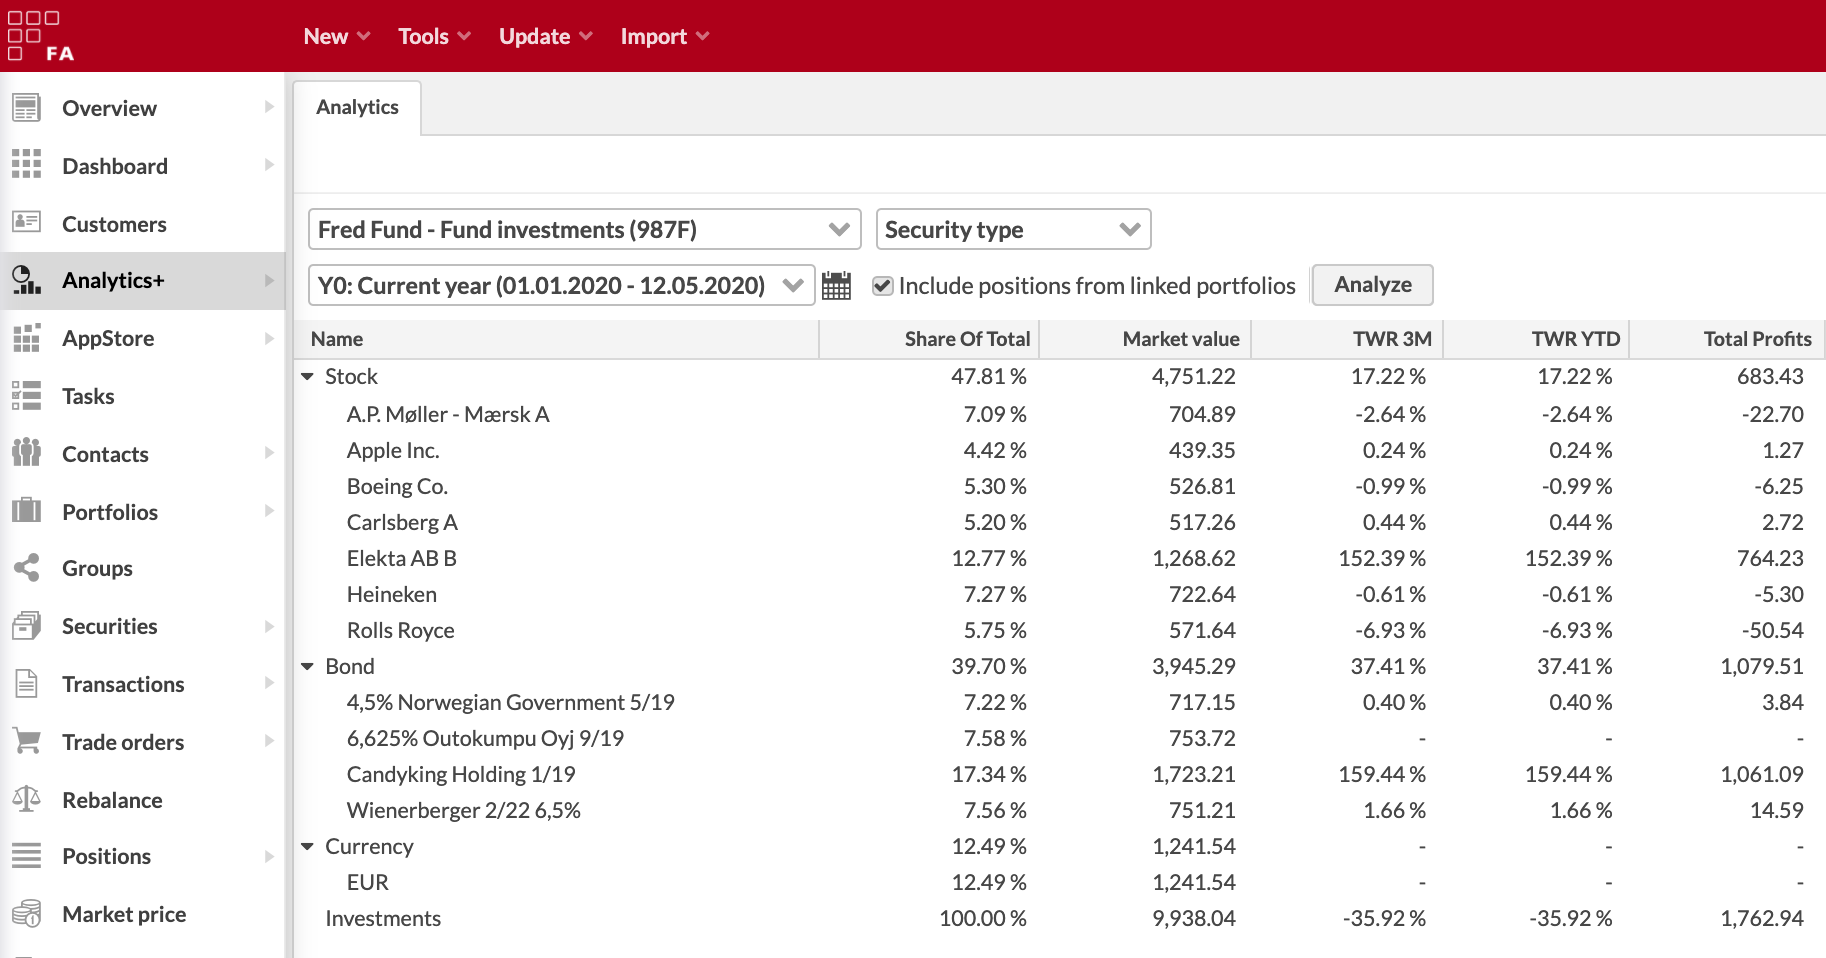
You can enable this feature by checking "Include positions from linked portfolios" within the analysis parameters at the top. Things you should consider when using this drill down approach:
The underlying positions fetched through the linked portfolio(s) are categorized according to the characteristics of each underlying security and the groupings you select. For example, underlying stocks might be categorized as "Stock" and underlying bonds might be categorized as "Bond", even when your actual investment might have been categorized as "Fund".
Aggregate group-level figures (e.g. the total-level figures for "Stocks" and "Bonds") are estimates, and calculated based on aggregating values calculated for the underlying positions. See Drill-down logic for more details on how the position-level figures are derived.
A single security is shown in the analysis only once - if the same security is found on multiple levels, the values are aggregated and shown as a single position. For example, if you own "Equity X" directly and through a fund, you would only see one position for "Equity X", summing up your direct investment and your investment through the fund.
Underlying positions are fetched recursively, and only the "position on the lowest level" are included in your analysis. If your linked portfolio contains a position that has been linked further to another portfolio (e.g. your fund contains another fund), the fund within the fund is replaced with its underlying positions.
The result doesn't indicate where a particular position originates / was fetched from. An individual position shown in the analysis might have been owned by the portfolio directly, or it might have been fetched from multiple levels down from a fund-of-fund structure. If you want to keep track of origins of the positions, consider visualizing the drill down hierarchy.
Visualize the drill down hierarchy
Custom groupings Drill down hierarchy allow you to visualize the hierarchy of your investments. When underlying positions are included, these custom groupings show a drill down to the underlying investments as a tree structure under your actual position. As a result, contents of a fund would be shown in a tree structure below the fund position.
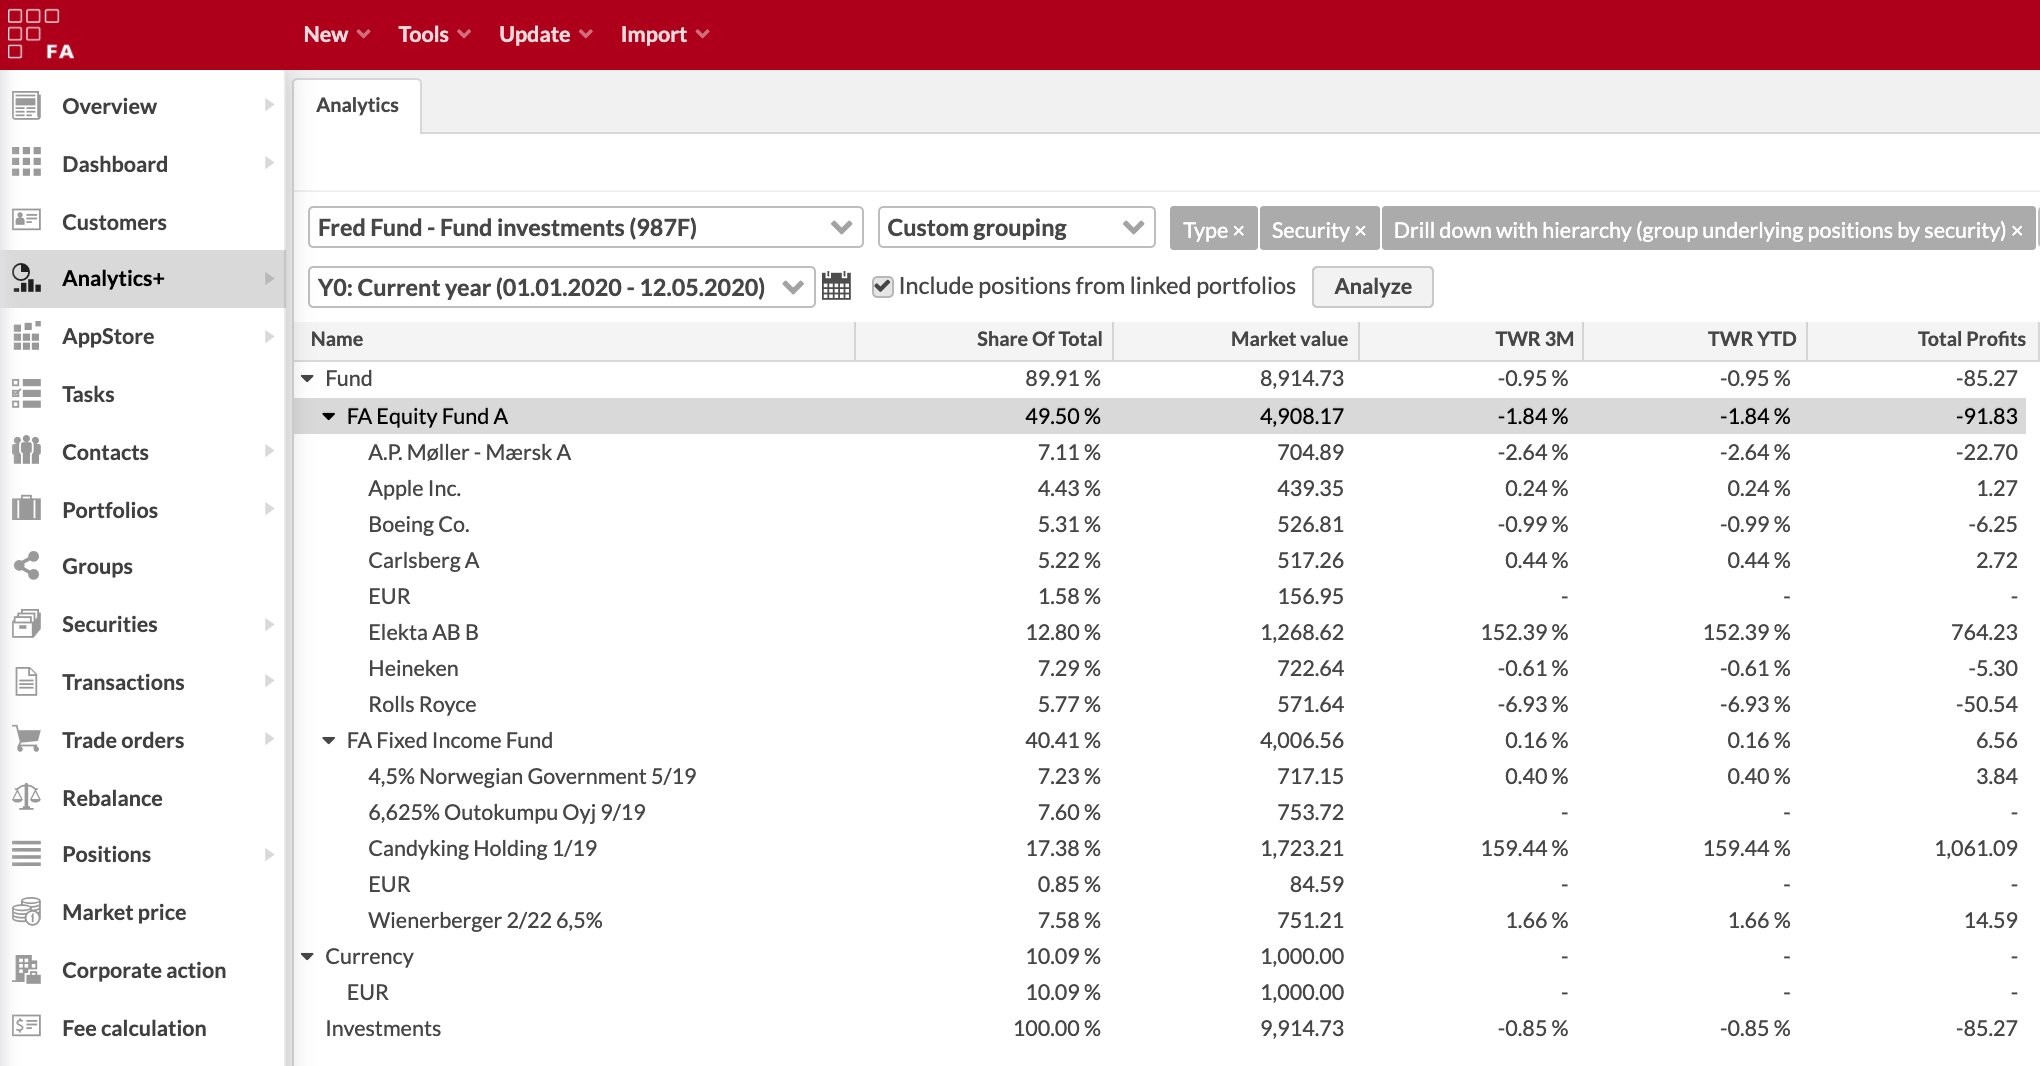
You can enable this feature through "Custom grouping": include either of the two "Drill down with hierarchy" groupings as the last item within your custom grouping, and the drill down hierarchy will be drawn below any position with a linked portfolio. For example, if you want to show a grouping by security type, and show a drill down under each position, define a custom grouping of "Type"+ "Security" + "Drill down with hierarchy". The two drill down options are:
Drill down with hierarchy (group underlying positions by position) - shows the underlying positions, and groups them "by position" (e.g. showing accounts with account name instead of account currency)
Drill down with hierarchy (group underlying positions by security) - shows the underlying positions, and groups them "by security" (e.g. showing accounts with account currency)
Things you should consider when using this drill down approach:
"Drill down with hierarchy" groupings show the hierarchy only when you have checked the "Include positions from linked portfolios" within the analysis parameters at the top.
Drill down with hierarchy can only be drawn under groupings "Security" or "Position" - if you don't have the position-level visible, the hierarchy cannot be drawn below the actual position. Best practice is to add the "Drill down with hierarchy" groupings as the last items within a custom grouping, and use either "Security" or "Position" grouping before them. Before that, you can use any grouping you like, as long as your custom grouping ends with ... "Security" / "Position" + "Drill down hierarchy".
Your positions are categorized based on the characteristics of your actual position and the groupings you select. For example, your actual investment might be a fund and be catagorized as "Fund", even if the underlying positions shown below the fund would be stocks or bonds.
All values shown until the underlying positions are picked up directly from your portfolio, and are always the same regardless of whether you choose to show the underlying investments or not. Values calculated for underlying positions are estimates - see Drill-down logic for more details on how the position-level figures are derived.