Add a column based on formula
Configuration
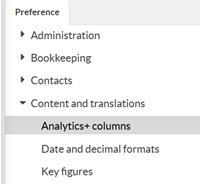
Setup of Analytics column definitions is done in FA Back under Preference → Content and translations → Analytics+ columns.
Preferences | Definition list |
 | 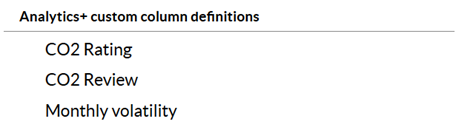 |
Adding new column definition
To add a new column definition, click Add new column. A selection of how to define the column is presented: Based on security key figure, or Based on a formula. Select Based on a formula.
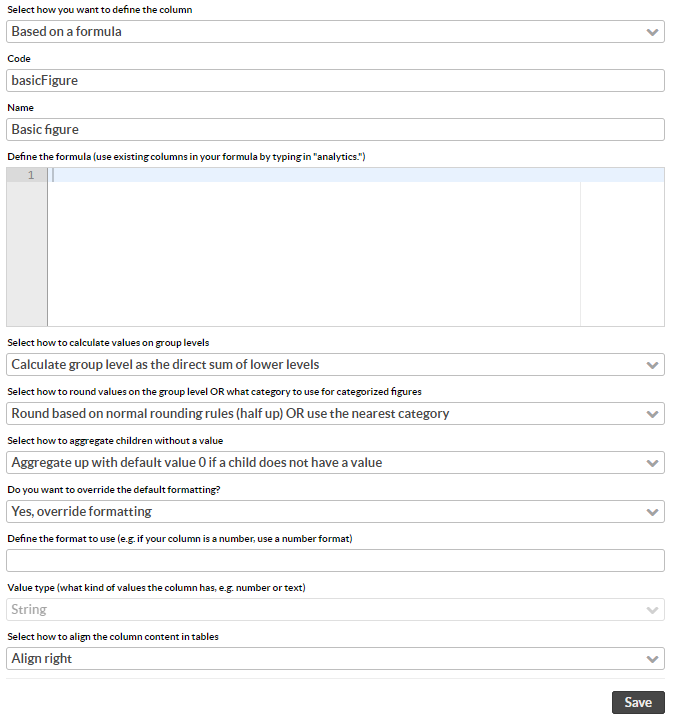
Choose a unique analytics column Code. After the column definition is saved, this is not possible to change. Only non-existing codes are allowed when adding a new column.
Choose column Name.
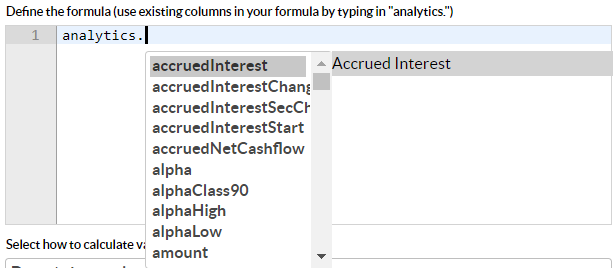
Define the Formula. This is a free form groovy script which will be compiled at save time, and run directly at run time of analysis. Several prefixes are available for data binding:
"analytics." gives all standard Analytics+ columns available on group or position level. By specifying the prefix followed by the column code (a dropdown is presented) data for the corresponding column will be loaded at runtime and available for formula calculation. An example is to simply sum two available columns as seen in e.g. Analytics+ tables, since these are shown after analysis is aggregated.
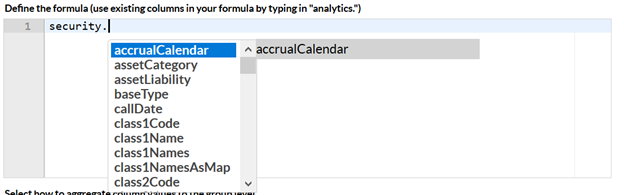
"security." Security fields are available by specifying this prefix followed by the corresponding field code. Note that not all Security fields are bound into Analytics+.
"data" contains a map of date and daily indexed return values which the whole analytics calculation is based on. This will be available for any position or group level, on each day in the analysis period. A helper suggestion binding is added for the prefix "ird." which can help when creating an iterator through the series
Note
NOTE. Any valid Groovy or Java code snipped is allowed. If you define an incorrect formula, you will be notified at the time of saving and prompted for correction. The anticipated return type of the formula is used to define the default value type of the column.
Creating Formulas
The formula window allows you to write Groovy and/or Java code as a script, which will then be pre-compiled and run at runtime in the Analytics+ Engine.
Accessing groupped analytics object - “analytics”
The main analysis object (GrouppedAnalyticsTimePeriodDTO) is available as “analytics.” in the context sensitivity and will give you a dropdown of available class fields on the object:
Retrieving holding period dates
Start and end dates are available on the "analytics" object in the custom formula window. Referencing analytics.startDate and analytics.endDate will give you the start/end date of the relevant investment period for a given position that has been analyzed. This will not necessarily be the selected period, as it will differ if a position started after the start date of your selection and vice versa for end date. This period is also what is used when looking at annualized figures which should suit many applicable purposes for analysis.
For example the simple formula
analytics.startDate
will give you the start date but not earlier than the positions/groups start date. Here it is recommended to override the format with e.g. "yyyy-MM-dd" if it is showed in FA Back Analytics UI.
Calculating investment period
Using the holding period dates, the investment period t in terms of years can also be calculated, by for example
import java.time.LocalDate;
import java.time.temporal.ChronoUnit;

double investmentPeriod = 0.0d;
double daysInYear = 365.0d;

//Start/End by default position-based
LocalDate startDate = analytics.startDate
LocalDate endDate = analytics.endDate

if(startDate && endDate)
  investmentPeriod = ChronoUnit.DAYS.between(startDate, endDate) / daysInYear

return investmentPeriod
Accessing security information - “security”
If any security (AnalyticsSecurityDTO) is available on the corresponding analysis level, it can be accessed by “security.” which in a similar way will give you a dropdown of available security fields:
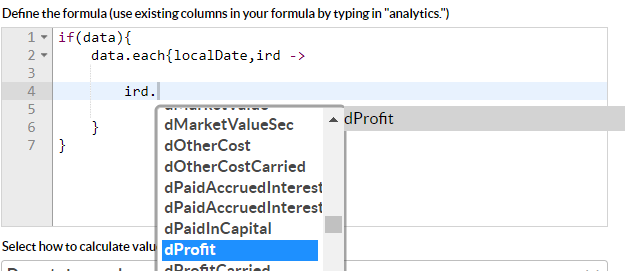
Accessing underlying indexed return data - “data”
The third type of data which is accessible in for the formula is the underlying daily time series of indexed return data. This is available as a map called “data” (more precisely NavigableMap<LocalDate, IndexedReturnDataDTO>). The data itself is not linked to any code-completion but there is a mapping for the IndexedReturnDataDTO which can be accessed by naming a variable “ird”, as per below:
This function should be used with caution, but can provide the user with an even greater set of possibilities in terms of what values to calculates as a custom column. It is not recommended to create too many formulas with this approach since it will require unnecessary iterations. If you need to calculate several values this way, it might be worth investigating if other values on the group level can be used instead - or simply calculate several variables and return the value as a string (for example json string) to be used in e.g. an API.
Helper for accessing calculated custom column values
If you want to access key figures on the security object, helper suggestions are available if you retrieve and define the key figure values as an object named “customColumnValue” and ending with a “.”
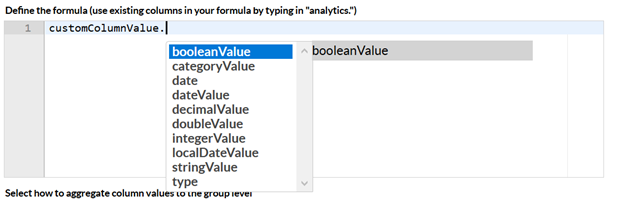
Please note that values on the CustomColumnValue object needs to be accessed by the corresponding getter, for example “customColumnValue.getBooleanValue()” and that this variable is not directly bound to any data. It is just a helper variable which allows you to work with calculated values more easily.
Available utilities to help developing formulas
AnalyticsUtil
AnalyticsUtil contains a set of static methods that helps converting the underlying data into an appropriate format for the formula. In order to use the util class, its needs to be imported within the formula:
import com.fasolutions.data.analytics.AnalyticsUtil
The AnalyticsUtil contains the following methods
Method | Params | Return | Description |
|---|---|---|---|
monthlyData | data | NavigableMap<LocalDate, IndexedReturnDataDTO> (same as data) | Return a dataset similar to data but containing only datapoints on the last day of each month. Note that the change values have not been converted. It is useful when formula should be based on monthly data. |
weeklyData | data | NavigableMap<LocalDate, IndexedReturnDataDTO> (same as data) | Return a dataset similar to data but containing only datapoints on the same day of each week as the last day in the dataset. Note that the change values have not been converted. It is useful when formula should be based on weekly data. |
doubleArray | data, attributeName | double[] | Generates a double array out of the given list of IndexedReturnDataDTO object’s attribute. E.g. you can pass "marketValue" as an attribute name to generate a double array or market values. |
secPerformance | data | SecPerformance (see below) | Create SecPerformance (fa-math) initialized with the data from the given GrouppedAnalytics' data. |
stats | double[] data | Creates DescriptiveStatics class from commons-math3 for doing basic statistical analysis on the given data such as mean or percentile. E.g. AnalyticsUtil.stats(data).mean call would return a arithmetic mean of the given dataset (double[]) |
SecPerformance
SecPerformance is a helper class from fa-commons/math project. In order to use that in your formula, you first need to import it and then initialize it with data from your underlying data set.
SecPerformance has several constructors to initialize it with different types of datasets:
Initialize without benchmark and with fixed risk free rate
SecPerformance(double[] secYields, double rfYield, int period, boolean reqAllData)
Initialize without benchmark and with variable risk free rate
SecPerformance(double[] secYields, double[] rfYields, int period, boolean reqAllData)
Initialize with benchmark and with fixed risk free rate
SecPerformance(double[] secYields, double[] rfYields, int period, boolean reqAllData)
Initialize with benchmark and with variable risk free rate
SecPerformance(double[] secYields, double[] bmYields, double[] rfYields, int period, boolean reqAllData)
period = Number of datapoints required for the analysis
reqAllData = true/false: true = if given dataset has less than the required number of datapoints, SecPerformance is initialized without any data. false = SecPerformance is initialized with given dataset.
If you want to analyze the data no matter how many datapoints it has, given the length of the dataset as period and reqAllData as false.
Example of constructing the SecPerformance without benchmark and with fixed risk free rate:
import com.fasolutions.math.var.SecPerformance
import com.fasolutions.data.analytics.AnalyticsUtil

def pfYields = AnalyticsUtil.doubleArray(data,"indexedValueChange") // Note these are logarithmic change values
def riskFreeRate = 0.01 // Risk free rate is fixed 1%

SecPerformance secPerformance = new SecPerformance(pfYields,riskFreeRates,pfYields.length,false);
secPerformance.set_noBenchmark(0.0d); // If no benchmark, return 0.0 instead of NaN
Example of constructing the SecPerformance with benchmark and with fixed risk free rate:
import com.fasolutions.math.var.SecPerformance
import com.fasolutions.data.analytics.AnalyticsUtil

def pfYields = AnalyticsUtil.doubleArray(data,"indexedValueChange") // Note these are logarithmic change values
def bmYields = AnalyticsUtil.doubleArray(data,"benchmarkIndexedValueChange") // Note these are logarithmic change values
def riskFreeRate = 0.01 // Risk free rate is fixed 1%

SecPerformance secPerformance = new SecPerformance(pfYields,bmYields,riskFreeRates,pfYields.length,false);
secPerformance.set_noBenchmark(0.0d); // If no benchmark, return 0.0 instead of NaN
SecPerformance methods | Description |
|---|---|
double alpha(double ext, boolean isLog) |
|
int alphaClass(double confidence) | int _alphaIsNegative = 1; int _alphaIsZero = 2; int _alphaIsPositive = 3; |
double alphaInterval(double ext, double confidence, boolean isLog, boolean low) |
|
double appraisalRatio(double ext, boolean isLog) |
|
double beta() |
|
int betaClass(double confidence) | int _betaGreaterThanOne = 1; int _betaEqualToOne = 2; int _betaLessThanOne = 3; int _betaEqualToZero = 4; int _betaLessThanZero = 5; |
double betaInterval(double confidence, boolean low) |
|
double correl() |
|
double excessReturns(double ext, boolean isLog) |
|
double m2(double ext, boolean isLog) |
|
double match() |
|
double r2() |
|
double sharpe(double ext, boolean retBm, boolean isLog) |
|
double informationRatio(double ext, boolean isLog) |
|
double m2(double ext, boolean isLog) |
|
double periodReturn(double ext, boolean isLog) |
|
double specificVolatility(double ext) |
|
double totalReturn(boolean retBm, boolean isLog) |
|
double trackingError(double ext) |
|
double treynor(double ext, boolean retBm, boolean isLog) |
|
double treynorSquare(double ext, boolean isLog) |
|
double volatility(double ext, boolean retBm) |
|
double volatilityEwma(double ext, boolean retBm) |
|
double adjBeta(double adjFactor) |
|
double avgReturns(double ext, boolean retBm, boolean isLog) |
|
Note on the parameters:
boolean retBm = true, returns statistics for benchmark instrument
boolean retBm = false, returns statistics for the security
boolean isLog = true, returns statistics in logarithmic terms
boolean isLog = false, returns statistics in percents
int ext = the parameter determines in terms of which period (daily, annualized etc.) the statistics are return. Example: If the data consists of daily returns and the number of days per year is 365, then parameter value ext = 1 returns daily statistics and ext = 365 returns annualized statistics.
Confidence levels (in alphaInterval, alphaClass, betaInterval and betaClass) are two-tailed.
Formula validation
Once you are done with your formula, it will compile at time of Saving the column definition. At the same time, a check will be done on the validity of your formula code - so don’t worry about making mistakes in your formula, the system will most likely tell you if you did! If for some reason the formula cannot be compiled, a popup will show and present you with an error message corresponding to the likely reason it failed: