Ex-ante costs and charges, detailed calculation logic
Overview
If you don’t understand the figures that the ex-ante costs and charges report gives you, this page is for you. Note, that how the figures are calculated, and how they add up, has changed significantly in 12/2019 (report version 1.6 / projected costs API version 3.2). If you are using an older version of the API/report, the “Challenges with the previous cost projection logic” -section may be of interest to you.
Simple example and basic formulas
Projection parameters
Time: 2 years
Expected return: 8 %
Fees: 1% yearly management fee (ongoing cost)
Initial investment: 10 000 EUR
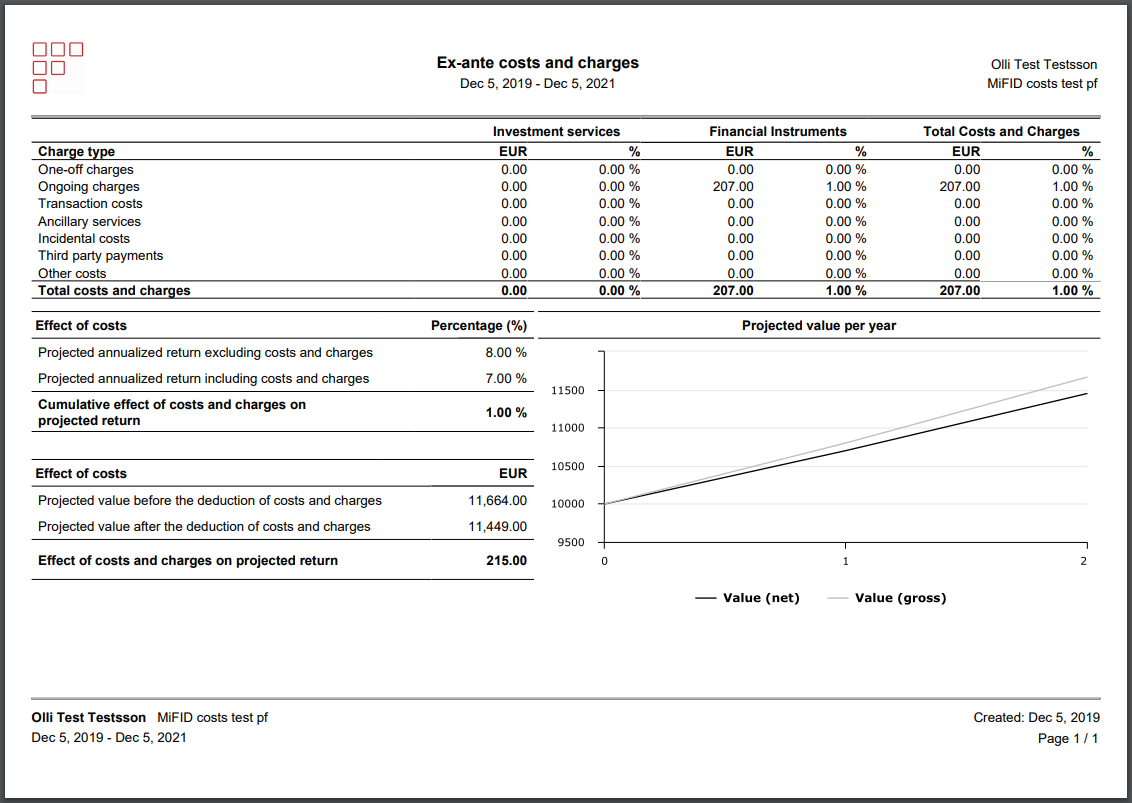 |
Q: Why is my 1% yearly management fee showing up in the table as 1.03%?
A: The table shows the total amount of costs deducted during the projection, whereas the Effect of costs (EUR) -section shows the difference compared to a scenario where there are no costs. These two things are not the same, because costs lower projected wealth exponentially every year, which in turn also lowers future costs. The first year’s costs leave us with 10 700 at the end of the first year instead of 10 800. The value of the return on this missing 100 is 8 EUR (100 * 1,08), which is the difference between the figures (215 - 207 = 8).
A simpler example which illustrates the same effect is, that the cumulative effect of a 100 EUR subscription fee on investment over many years is actually 100 EUR * (yearly return ^ years), not just 100 EUR.
Simple example + fixed startup cost
Projection parameters
Time: 2 years
Expected return: 8 %
Fees: 1% yearly management fee (ongoing cost), plus 100 EUR subscription fee (one-off charges)
Initial investment: 10 100 EUR
 |
Q: Why is my 1% yearly management fee showing up in the table as 1.03%?
A: The calculation is:
fee % = specific cost absolute value / total costs absolute value * effect of costs and charges on return
1.03% = 207 / 307 * 1.53%
What happened is, that the 100 EUR subscription fee is charged at the beginning of the projection, but the management fee is charged later. Therefore the subscription fee’s total effect on projected wealth is actually slightly higher than 0,5%, BUT we decided that it would be very confusing if the absolute figures and percentage figures weren’t comparable. So rather than have 100 EUR = 0.53% and right next to it 207 EUR = 1.00% (!!?), we chose simpler consistency. Note, that this effect only occurs with starting/ending fees (the latter of which isn’t supported at the time of writing).
Q: Where did the total cost value of 1,53% come from?
A: We calculate the projected wealth with and without costs as described in the Simple example and basic formulas-section:
No fees projected wealth = 10 100 EUR * (1,08 ^ 2) = 11 780,64 EUR
With fees = (Initial investment - startup fee) * (yearly return ^ years) = (10 100 - 100) * ( 1,07 ^ 2) = 11 449 EUR
From this information, we calculate the return including costs backwards from the projected wealth (including fees) figure:
Return % = (end value / start value) ^ (1 / number of years)
Return % = (11 449 / 10 100) ^ ( 1 / 2 ) = 1,06468979352468837 ~= 6,47%
The difference between these return percentages is 8% - 6,47% = 1,53%
Q: Why does the table show 307 EUR, but the Effect of costs (EUR) part shows 331,64 EUR?
A: This is answered in the “Simple example and basic formulas” -section. Same reason.
Portfolio costs, longer projection, higher return
Here’s an example that illustrates portfolio costs, as well as the fact that the length of the projection as well as the expected return may be changed.
Time: 10 years
Expected return: 10 %
Fees: 1% yearly fee on the security (ongoing charges, financial instruments), and 1% yearly portfolio fee (ongoing charges, Investment services)
Initial investment: 10 000 EUR
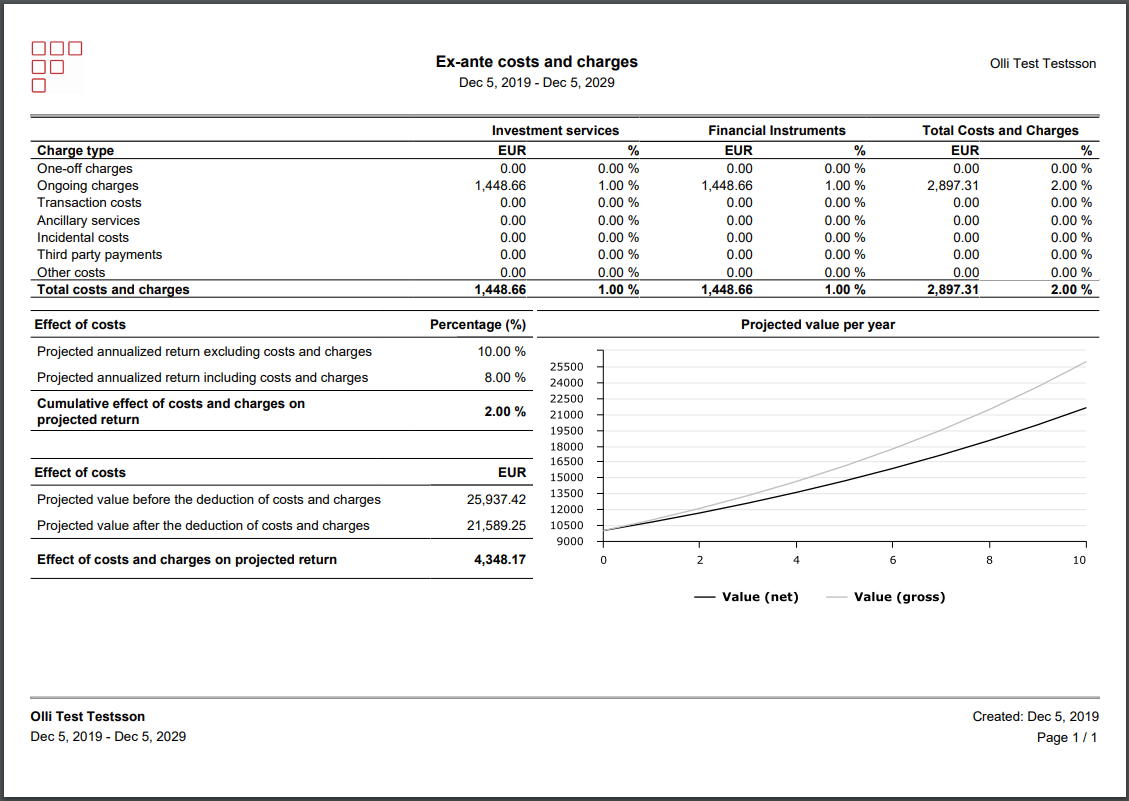 |
Projected value before the deduction of costs and charges: 10 000 EUR * (1,1 ^ 10) = 25 937,42 EUR
Projected value after the deduction of costs and charges: 10 000 EUR * (1,08 ^ 10) = 21 589,25 EUR
Q: Why are the total costs in the table 2 897,31 EUR but the effect of costs and charges is much higher (4 348,17 EUR)?
A: This is answered in the “Simple example and basic formulas” -section. Same reason.
The larger figure in the bottom is arrived at by subtracting the projected value figures from each other: 25 937,42 EUR - 21 589,25 EUR = 4 348,17 EUR.
The smaller figure is the sum of each year’s costs. A year’s fee is the yearly fee percent times the projected starting value of the portfolio during that year. E.g. year 1 cost = 10 000 * 0,02 = 200 EUR. Year two cost is 10 800 * 0,02 = 216. Year three cost is 11 664 EUR * 0,02 = 233,28 EUR and so on. The sum of this series is 2 897,31 EUR.
Kickbacks/third-party payments
Kickbacks, rebates, or third-party payments all refer to the same thing: compensation which is paid to an asset manager (or similar) to incentivize them to invest in specific investment products. E.g. a fund company may have an agreement to pay a certain portion of the fees that they collect to a specific asset manager who invests in the fund company’s funds. In this section, we will refer to such payments as kickbacks. They show up in the report with the name third-party payments.
Whether or not to include kickback calculation in cost projections is configurable (see the parent page for configuration instructions). If configured, kickbacks are calculated based on:
Security’s kickback percent (security basic info in the Cost info tab). This figure tells us what percentage of security costs are given back as rebates to our customer (asset management company or similar), not the end investor. Note that the kickback percentage currently affects all security costs.
Configurable kickback distribution percent (what percentage of kickbacks are distributed back to clients, from 0-100%). This is a global configuration, and tells us what percentage of the kickbacks received by our customer (asset management company or similar) are passed forward to the end investor. 0% = asset management company keeps all kickbacks/rebates, 100% = asset management company passes all the kickbacks/rebates forward to the end investor. Any values in between are also possible.
Security’s ex-ante costs
Kickbacks can show up in the report in two ways, depending on whether or not they are distributed back to clients:
Kickbacks which are NOT distributed back to end investors show up in the third-party payments row, and have an effect on the chart and “Effect of costs” -figures.
Kickbacks which ARE distributed back to end investors show up simply as reduced security costs.
E.g. Security which has a 2% yearly asset management fee (ongoing fee), which pays a 50% kickback, of which half is distributed back to clients, would show up as:
Security ongoing costs 1%
Third-party payments 0,5%
Note that the kickback percentages and distribution percentages do not apply to fees that are recorded directly on transactions. If you are projecting costs based on a specific transaction (or transactions), and want to record third-party payments, you should record those directly (in practice by setting up a transaction cost type “Undistributed third-party payments”, categorized into category 3rd (and most likely one-off).
Example: kickbacks fully distributed back to client
Time: 2 years
Expected return: 8 %
Fees: 1% yearly management fee (ongoing cost)
Initial investment: 10 000 EUR
Kickback percent: 30%
Percentage of kickbacks distributed to client: 100%
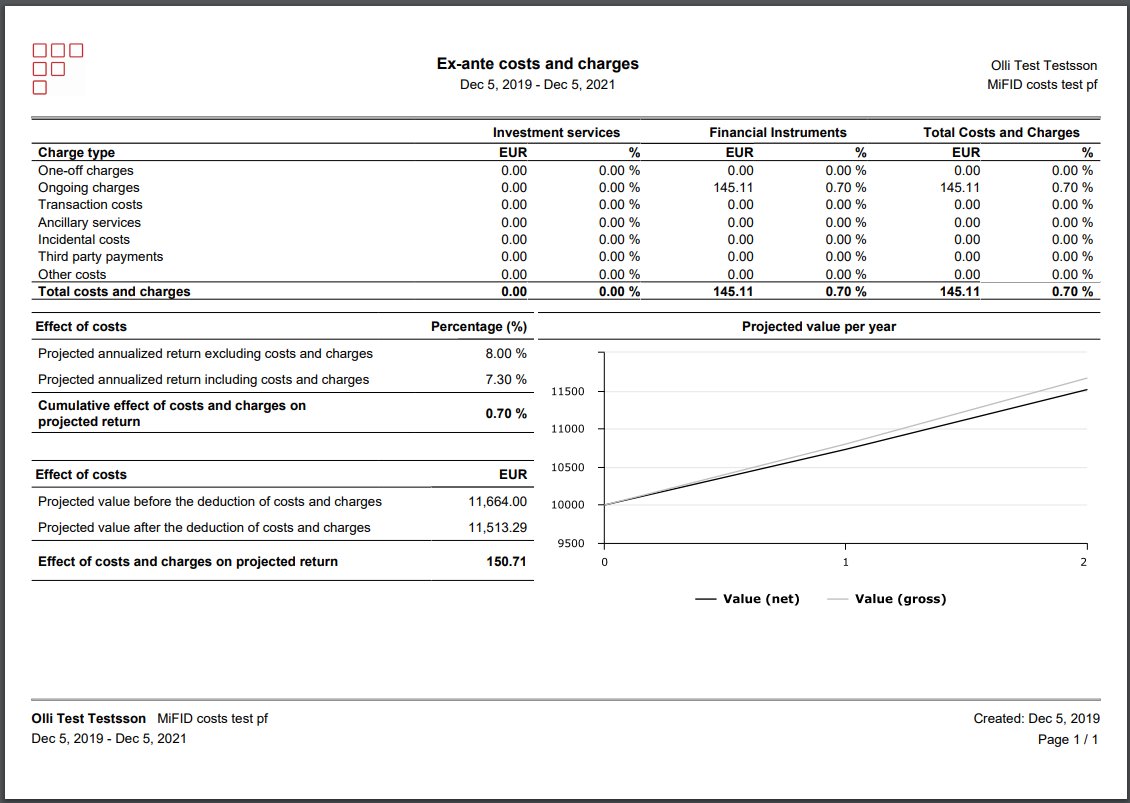 |
This example is exactly the same as the first basic example, except for kickbacks: we added a 30% kickback, which is fully distributed back to investors. The result is, that the security’s ongoing costs are reduced by 30% to 0,70% per year which is visible in the chart and totals figures as well. Third party payments are 0, because the asset manager (or similar) isn’t keeping any of the kickbacks.
Note that the report handles kickbacks which are re-distributed back to clients as discounts on the fees. If the cash is in reality credited to the investors' account, then this model is only accurate if such cash would be re-invested (in the model, the 0,3% per year which the end investor saves because of distributed kickbacks is re-invested for year 2). This is a fine assumption, because many investments pay dividends or generate other kinds of cashflows, which are also assumed to be reinvested.
Example: kickbacks partially distributed back to client
Time: 2 years
Expected return: 8 %
Fees: 1% yearly management fee (ongoing cost)
Initial investment: 10 000 EUR
Kickback percent: 30%
Percentage of kickbacks distributed to client: 50%
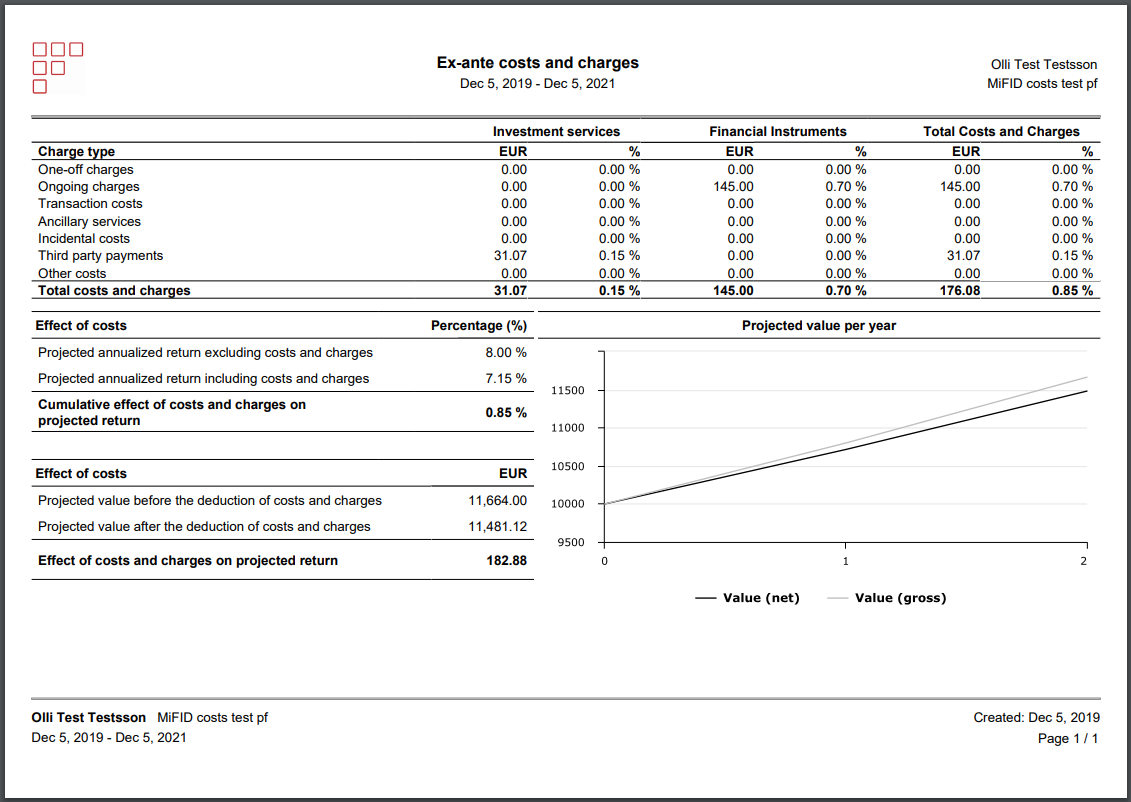 |
The only difference here, compared to the previous example, is that we distribute only 50% of the kickbacks back to the client; the asset manager keeps the other 50% for themself. The full kickback is reduced from security costs, but half of it (which is kept by the asset manager) shows up in the Third party payments -row. Note, that third party payments always show up in the Investment services -columns and the totals. As you might expect, the total yearly costs are now 0.85%.