Viewing options
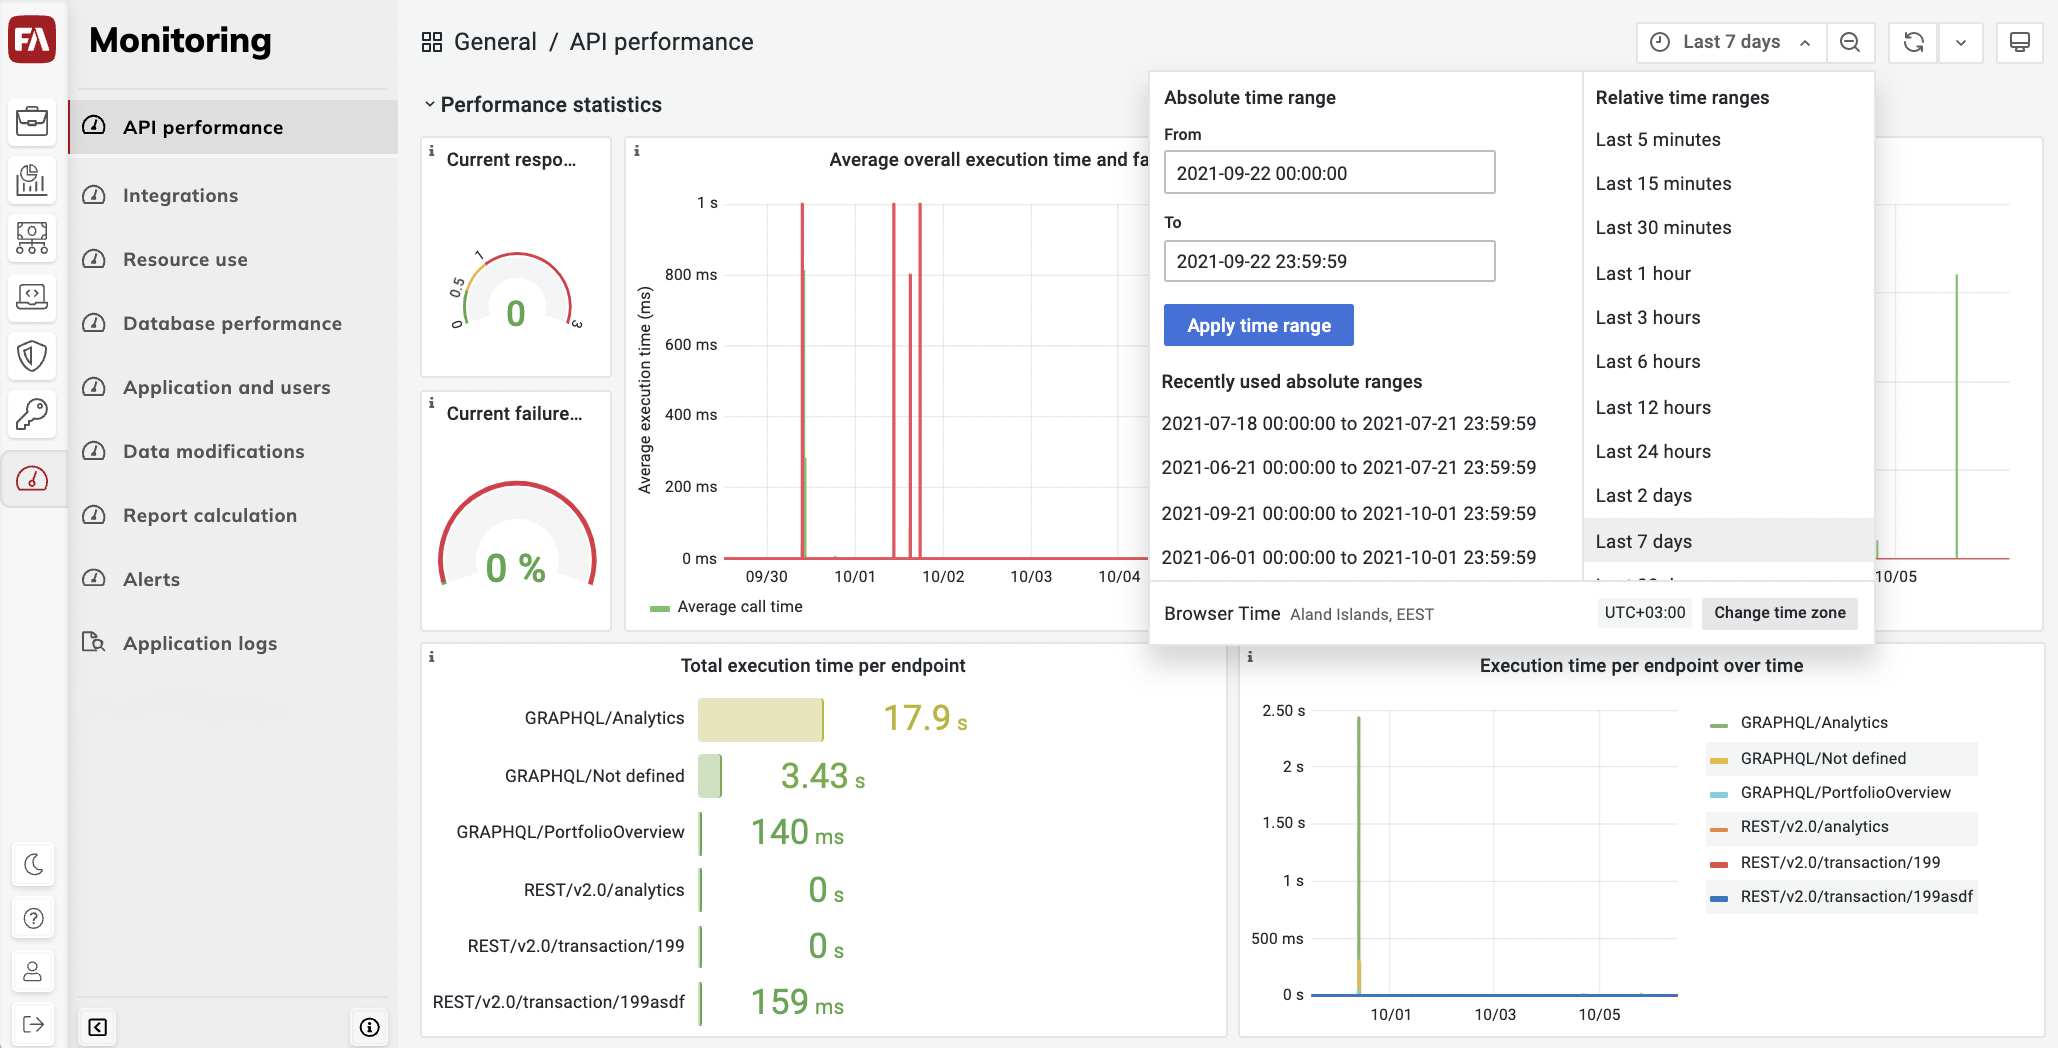
Each view features a set of charts that present data on a certain aspect of the FA platform. At the top of the view, you can control the time range, manage the data refresh settings, and switch to the fullscreen mode.

Time range
The time picker at the top lets you choose the time range to view the data for. Absolute time range has start and end point. Relative time range shows the data for the recent period, for example, last 5 minutes or last 12 hours.
To view the data for the previous or next period, use the arrow buttons.
To view a larger time range, click the magnifying glass.
For a detailed description of the time range controls, see Grafana documentation.
Refresh options
To refresh the data, click the refresh button. To refresh the dashboard regularly, click the down arrow next to the Refresh dashboard icon and choose a refresh interval.
Fullscreen view
To switch to the fullscreen view, click the screen icon. To exit the fullscreen view, press Escape.