Design a report using static data
Overview
This tutorial will teach you how to create a simple report in jsreport using static data. The report itself is not functional enough to be used with FA but the goal is to learn the basic of report creation. Using static data is a good way to work with the report design itself before turning it into a functional report.
Steps
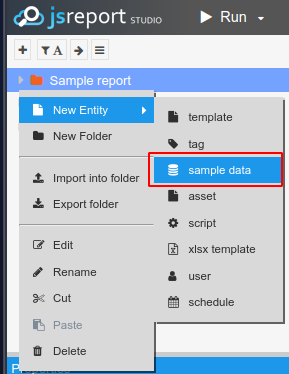
Step 1 - Create a folder for the report
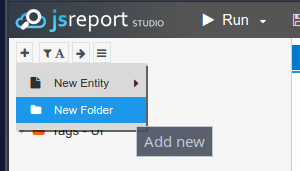
It is a good practice to structure the reports into folders. Therefore, the first step in creating a report is to create a folder in which you can put all files related to the report:
Name the folder to be the same as your report name, e.g. Sample report.
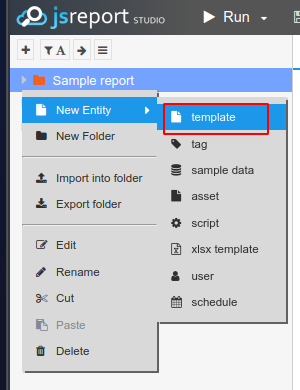
Step 2 - Create a report template
Next, right click on the Sample report folder and choose New Entity -> Template. Name the template Sample report.
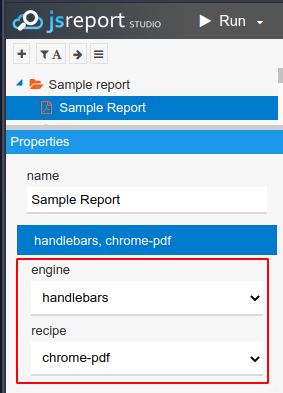
By default, the template is configured to produce a PDF report based on HTML syntax using a template engine called Handlebars.
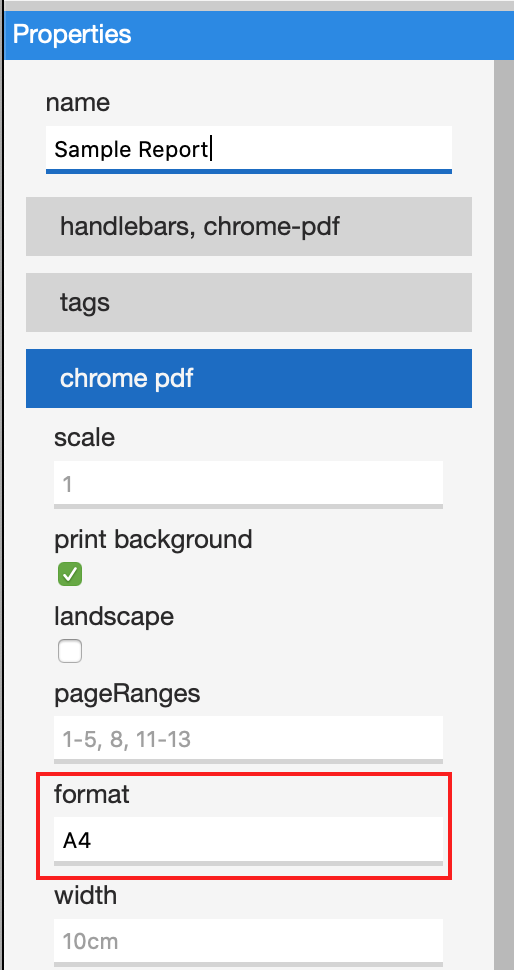
[Optional] The page setup could be adjusted as per requirement. For example, you can set the page format to A4 size instead of the letter size, which is the default setting.
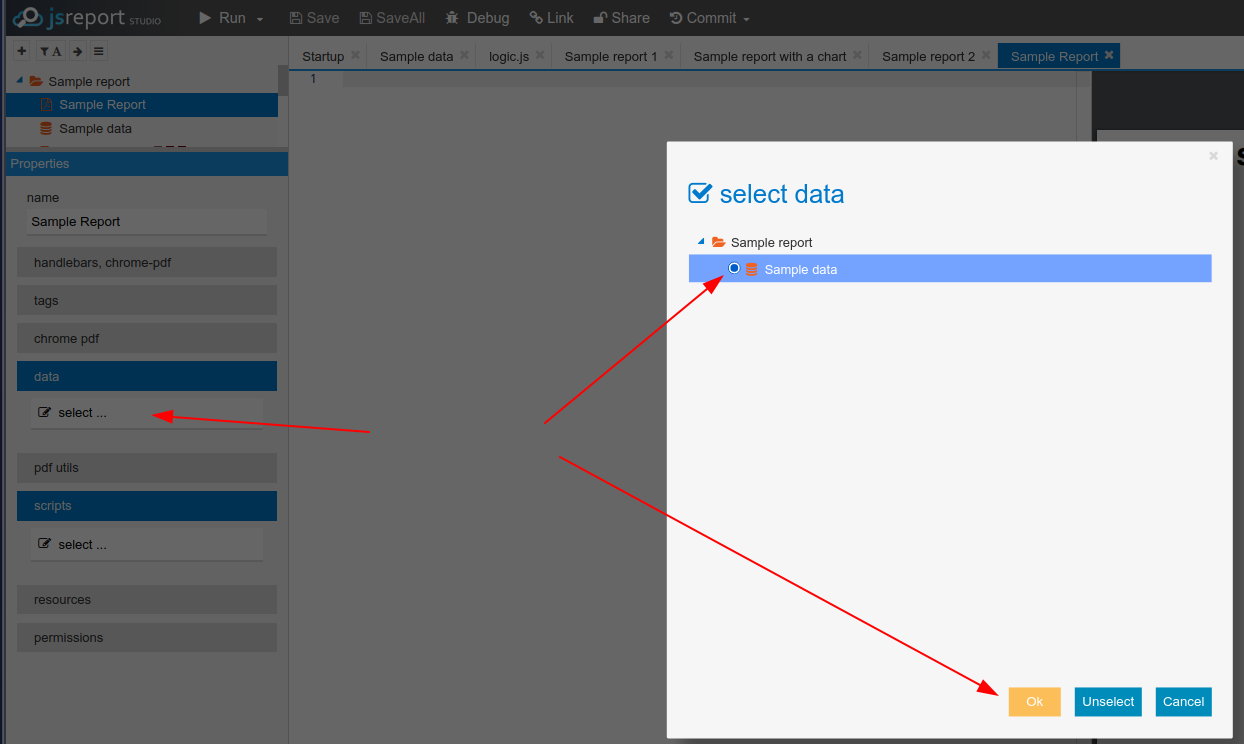
Step 3 - Create a sample data set for the report
Right click again on the sample report folder and create a new sample data set. Name it Sample data and link it to the your report, Sample report. Normally, you would create a data set using a GraphQL query that you plan to use in your report and then copying its output to be the sample data.
Open Sample data and copy the following JSON structure into it:
Sample data
{
"data": {
"portfolio": {
"client": {
"name": "Aaron Chan"
},
"portfolioName": "Investment portfolio",
"portfolioReport": {
"marketValue": 994682.9,
"cashBalance": 30678361.61,
"netAssetValue": 31673044.51,
"investments": [
{
"security": {
"name": "Vincit Oyj",
"securityCode": "VINCIT.HE"
},
"amount": 155,
"amountAfterOpenTradeOrders": 155,
"purchaseValue": 11185.49,
"positionValue": 9020.73,
"changePercent": -0.193532871604194
},
{
"security": {
"name": "Corem Property Group AB (publ)",
"securityCode": "CORE-PREF.ST"
},
"amount": 2913,
"amountAfterOpenTradeOrders": 2913,
"purchaseValue": 473344.2,
"positionValue": 961290,
"changePercent": 1.030847742509573
},
{
"security": {
"name": "Outokumpu Oyj",
"securityCode": "OUT1V.HE"
},
"amount": 666,
"amountAfterOpenTradeOrders": 666,
"purchaseValue": 1898.1,
"positionValue": 15115.03,
"changePercent": 6.963242189557979
},
{
"security": {
"name": "PledPharma AB",
"securityCode": "PLED.ST"
},
"amount": 1801,
"amountAfterOpenTradeOrders": 1801,
"purchaseValue": 57746,
"positionValue": 9257.14,
"changePercent": -0.839692099885706
},
{
"security": {
"name": "AB CALIFORNIA PORTFOLIO CLASS B",
"securityCode": "ALCBX.NMFQS"
},
"amount": 0,
"amountAfterOpenTradeOrders": 1000,
"purchaseValue": 0,
"positionValue": 0,
"changePercent": 0
}
]
}
}
}
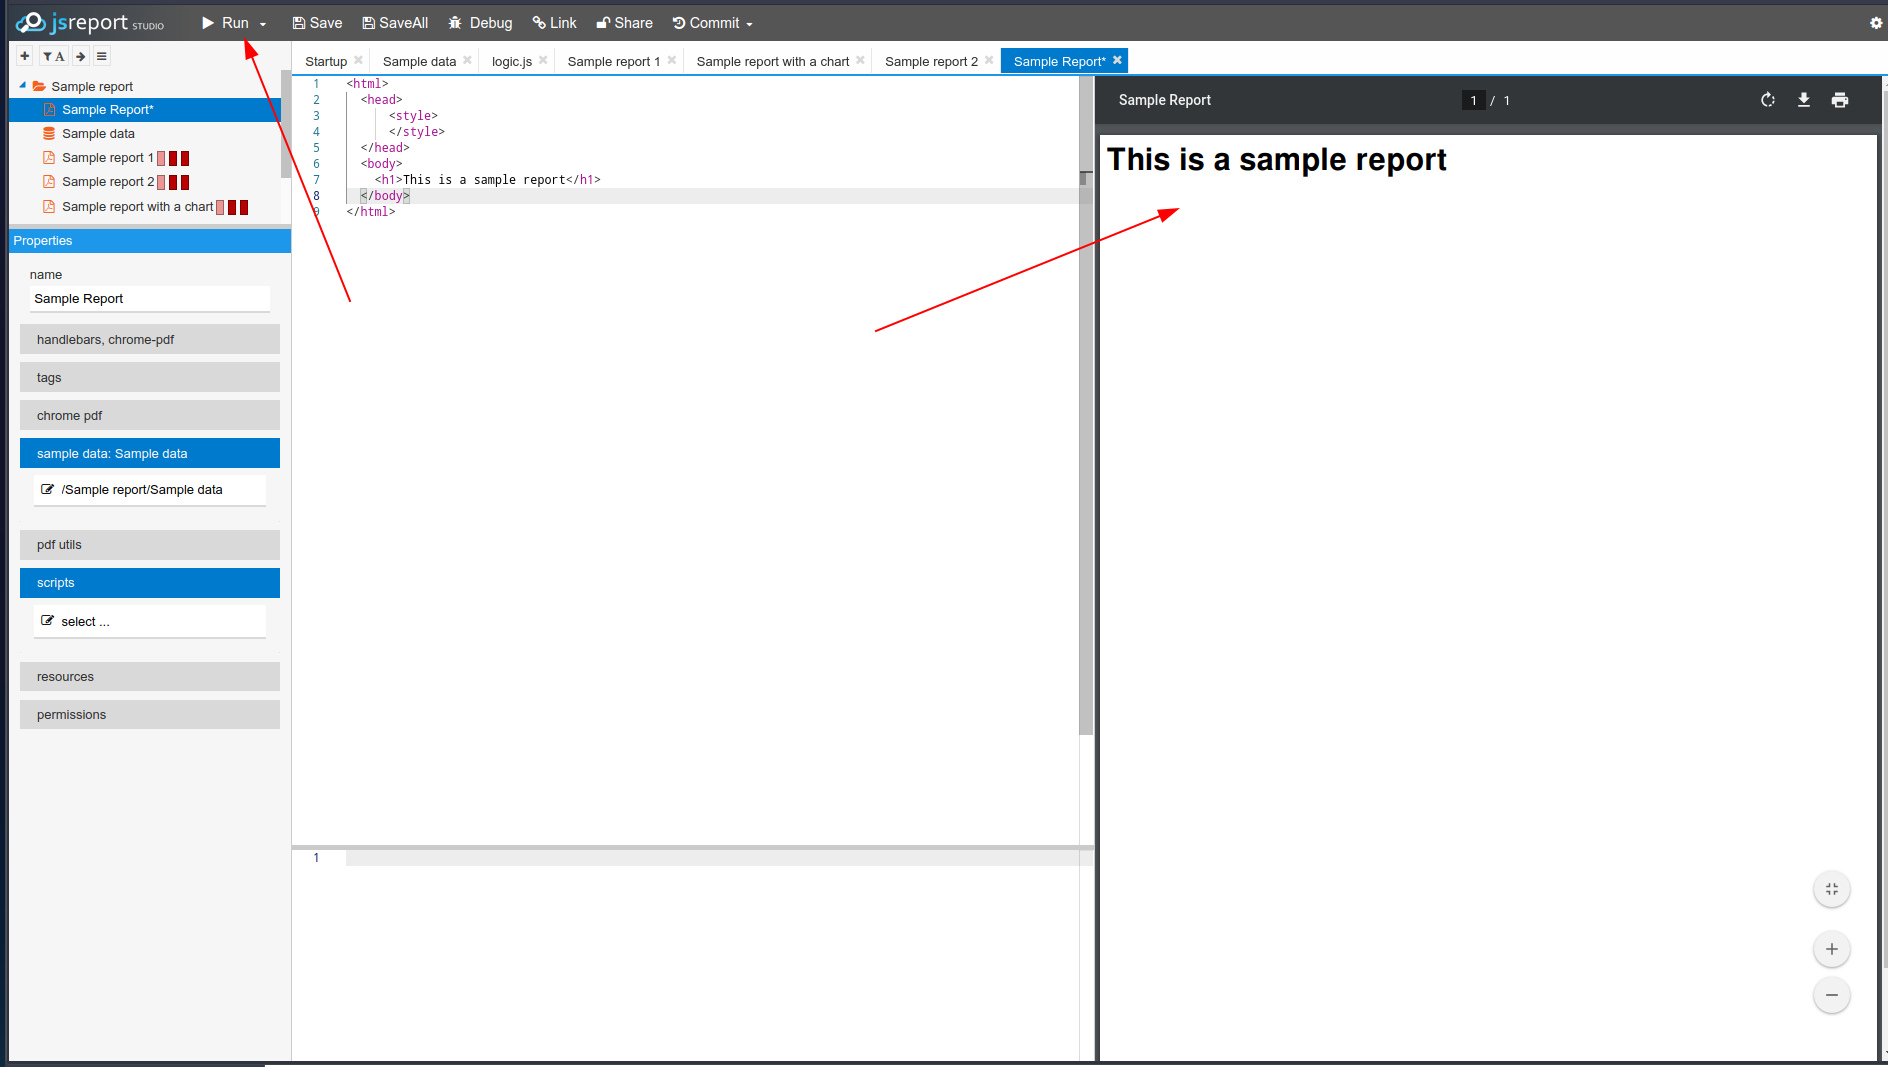
}Step 4 - Create a base template without dynamic content
Now, open the report template which you named Sample report. The report template is basically an HTML file. It can contain CSS styles and JavaScript code in addition to the standard HTML code. Also, the features from the selected templating engine are available.
Add the following code to the template:
Sample report without dynamic content
<html>
  <head>
      <style>
      </style>
  </head>
  <body>
    <h1>This is a sample report</h1>
  </body>
</html>
Then run the report to see the output in PDF format:
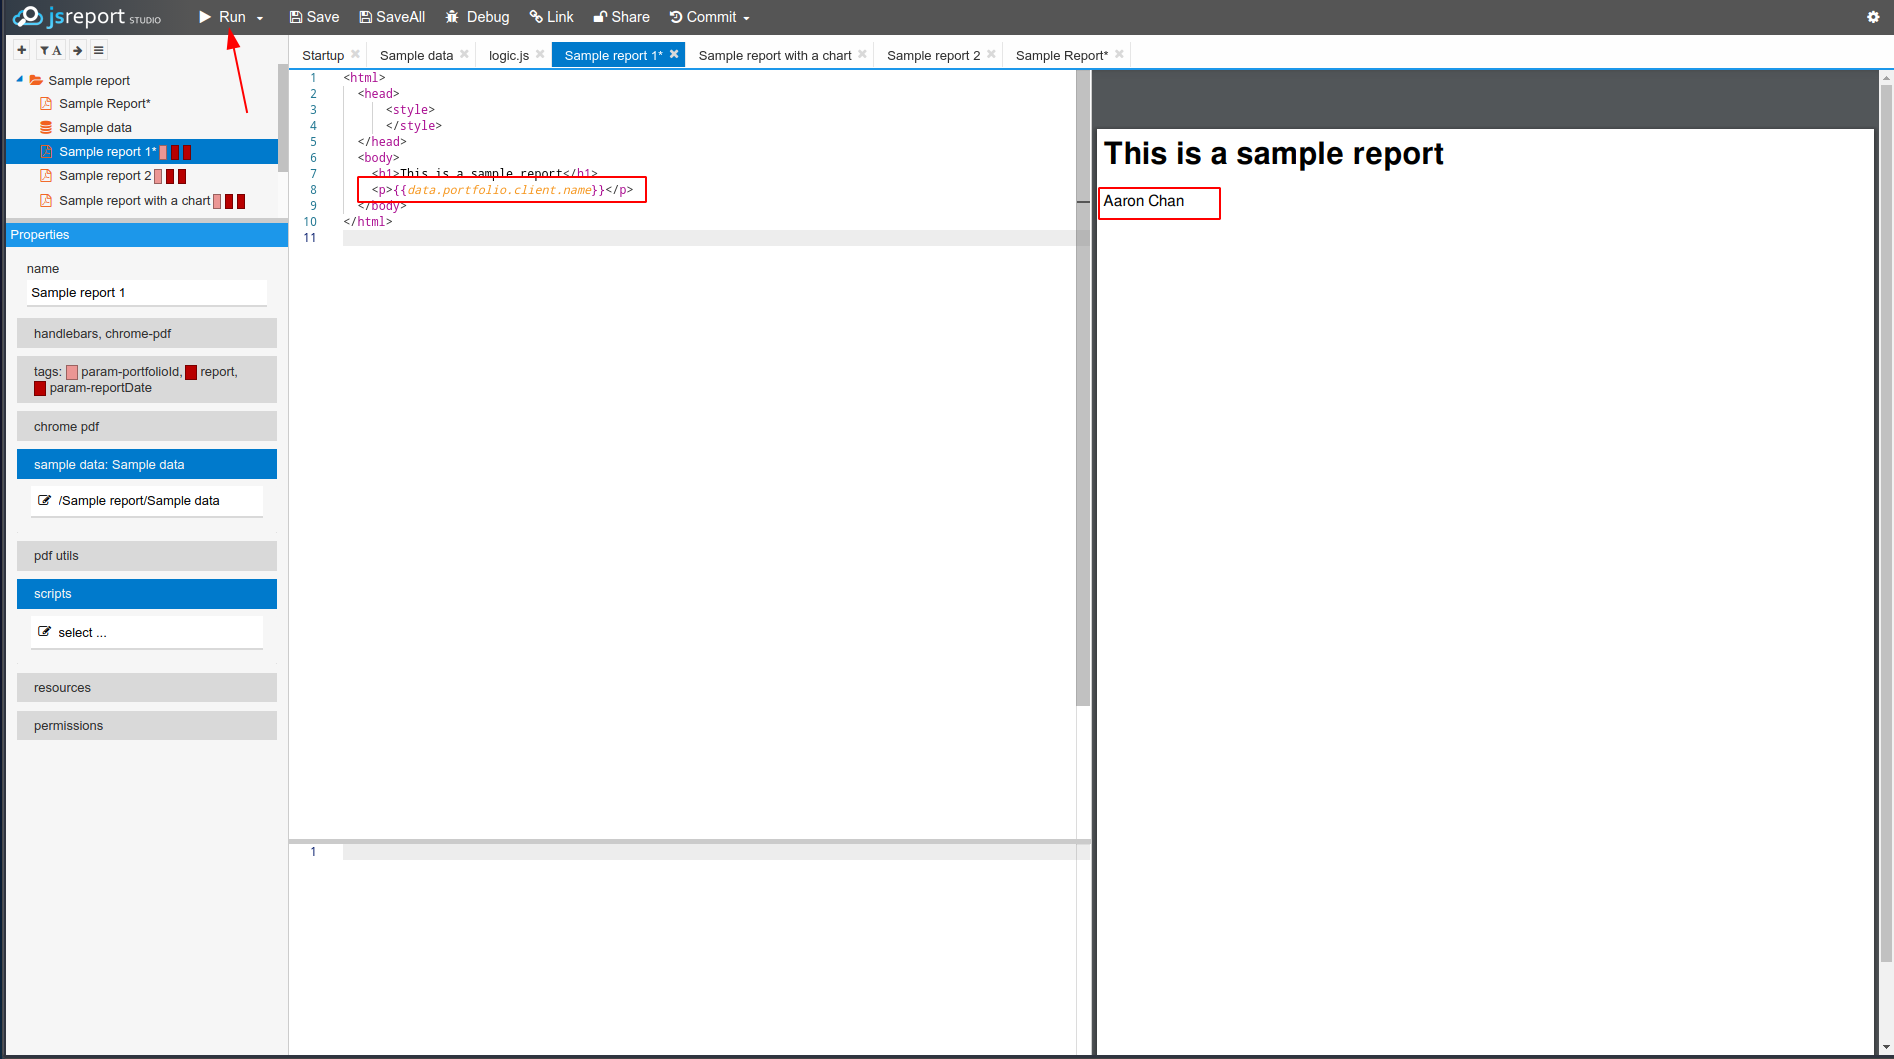
Step 5 - Add dynamic content from the sample data
In order to use values from the sample data in the report, you need to apply some syntax from the selected template library Handlebars. The template engine can access data from the JSON structure, iterate through it, have conditions and apply helper functions.
In order to get the client name value from the JSON structure, add the following line after the report title:
Sample report with dynamic content
<html>
  <head>
      <style>
      </style>
  </head>
  <body>
    <h1>This is a sample report</h1>
    <p>{{data.portfolio.client.name}}</p>
  </body>
</html>
When the report is run, the name from the sample data appears below the title:
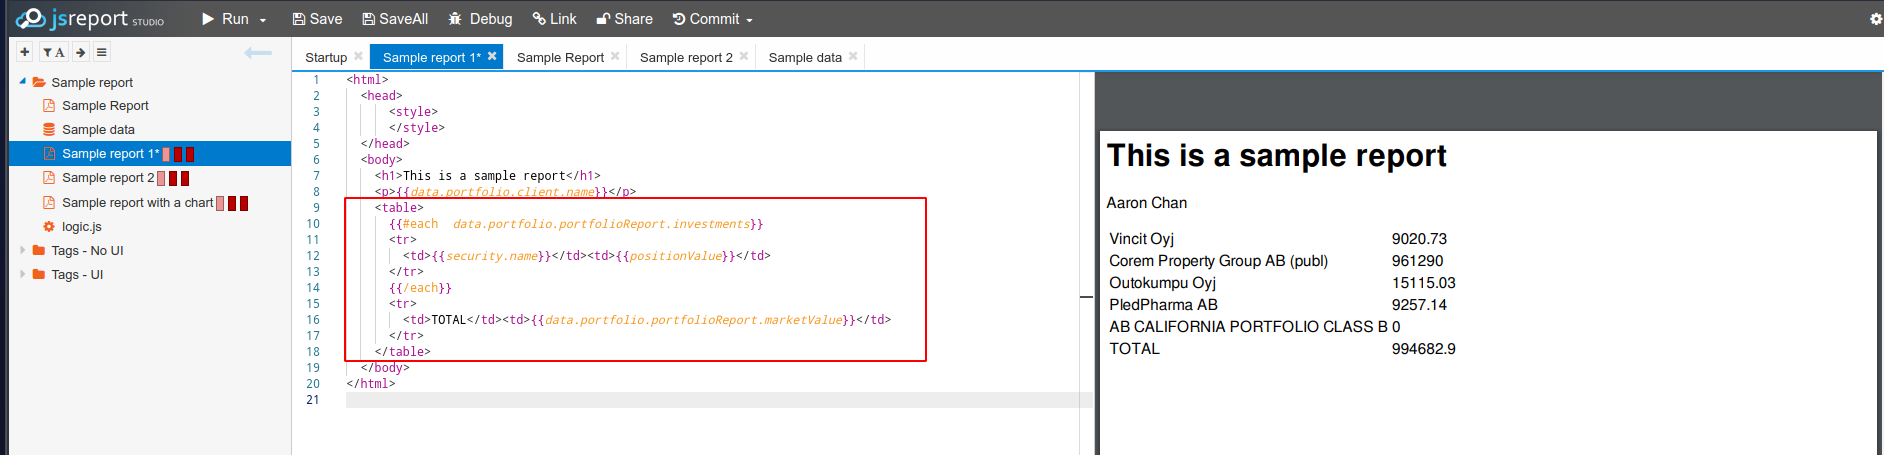
Step 6 - Looping through position data and showing it in a table
It it possible to loop through a data structure such as positions and then show the individual positions in a table. The size of the table (i.e. number of rows) depends on the number of positions. The below HTML code contains a dynamically created table with position data along with the total row produced from the sample data.
Creating a table from position data
<table>
  {{#each  data.portfolio.portfolioReport.investments}}
  <tr>
   <td>{{security.name}}</td><td>{{positionValue}}</td>
  </tr>
  {{/each}}
  <tr>
    <td>TOTAL</td><td>{{data.portfolio.portfolioReport.marketValue}}</td>
  </tr>
</table>
The output of this is as follows:
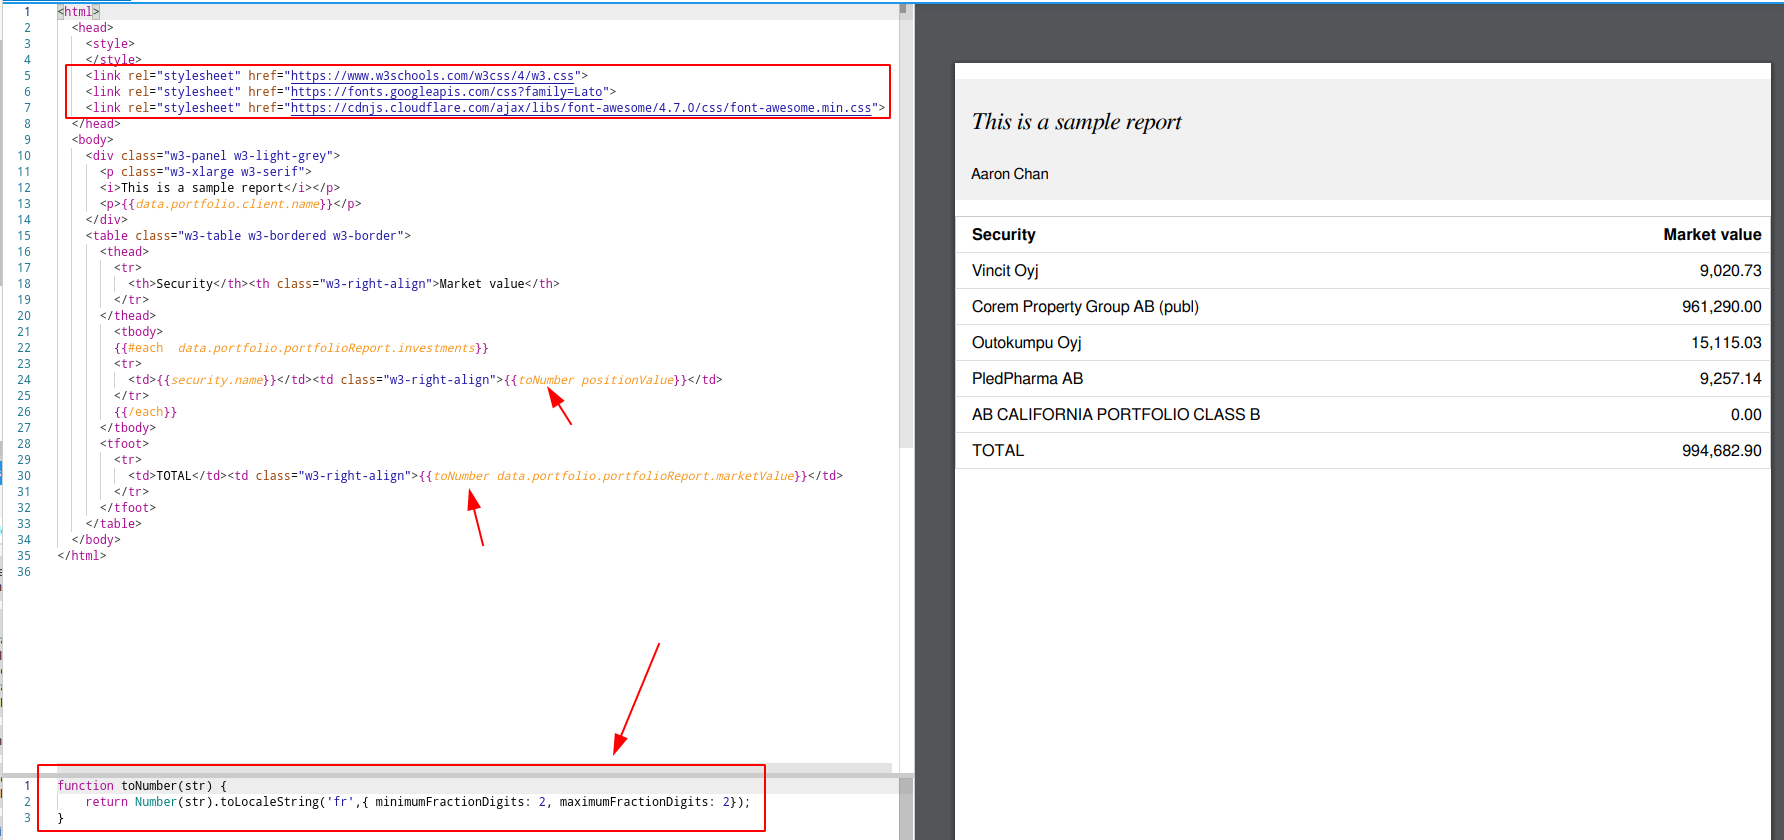
Step 7 - Styling the report
As mentioned earlier, the report is implemented using HTML and JavaScript. All the capabilities of those technologies are available to style the report as much as you want. In this tutorial, we would apply a free CSS template from w3schools.org to make the report look a bit nicer. In addition, we also apply a JavaScript function to format the market value with two decimals and a thousands separator.
Troubleshooting
I try to generate a report in the jsreport UI but when I click Run I get an error saying "TypeError: Cannot read property 'param-xyz' of undefined".
The report expects to receive parameters from FA Back but as the generation is triggered directly from the jsreport UI, the report script does not get the parameters. Running the report with dynamic data is explained in Convert a static report to a functional FA report.