Monitor processes in FA Platform
You can monitor processes in the Process monitoring view of the FA Admin Console. You can see which processes were run, how long they took, and if they were completed successfully. If a process is ongoing, you can see details about its progress and evaluate how long it may take. The view also provides input for monitoring the performance of processes over time.
The system monitors processes such as user-triggered and scheduled processes, authority and client reporting, and custom processes. For example, for nightly price updates and report calculations, the monitoring tracks the process through the following stages:
Start
Fetch active portfolios
Handle market data connector 1 (if enabled)
Find applicable securities
Fetch and save close prices
Update cashflow securities
Handle market data connector 2 (if enabled)
Handle market data connector 3 (if enabled)
Update discount factors (if no connectors 1-3 defined)
Schedule report updates
End
Tracked processes
The initial release of this feature covers the following processes, but the coverage will be expanded in future releases:
NAV calculation
NAV acceptance
NAV rollback
Run deferrals
NAV rejection
NAV acceptance interruption and NAV rollback
Corporate actions
Nightly price update and report calculation
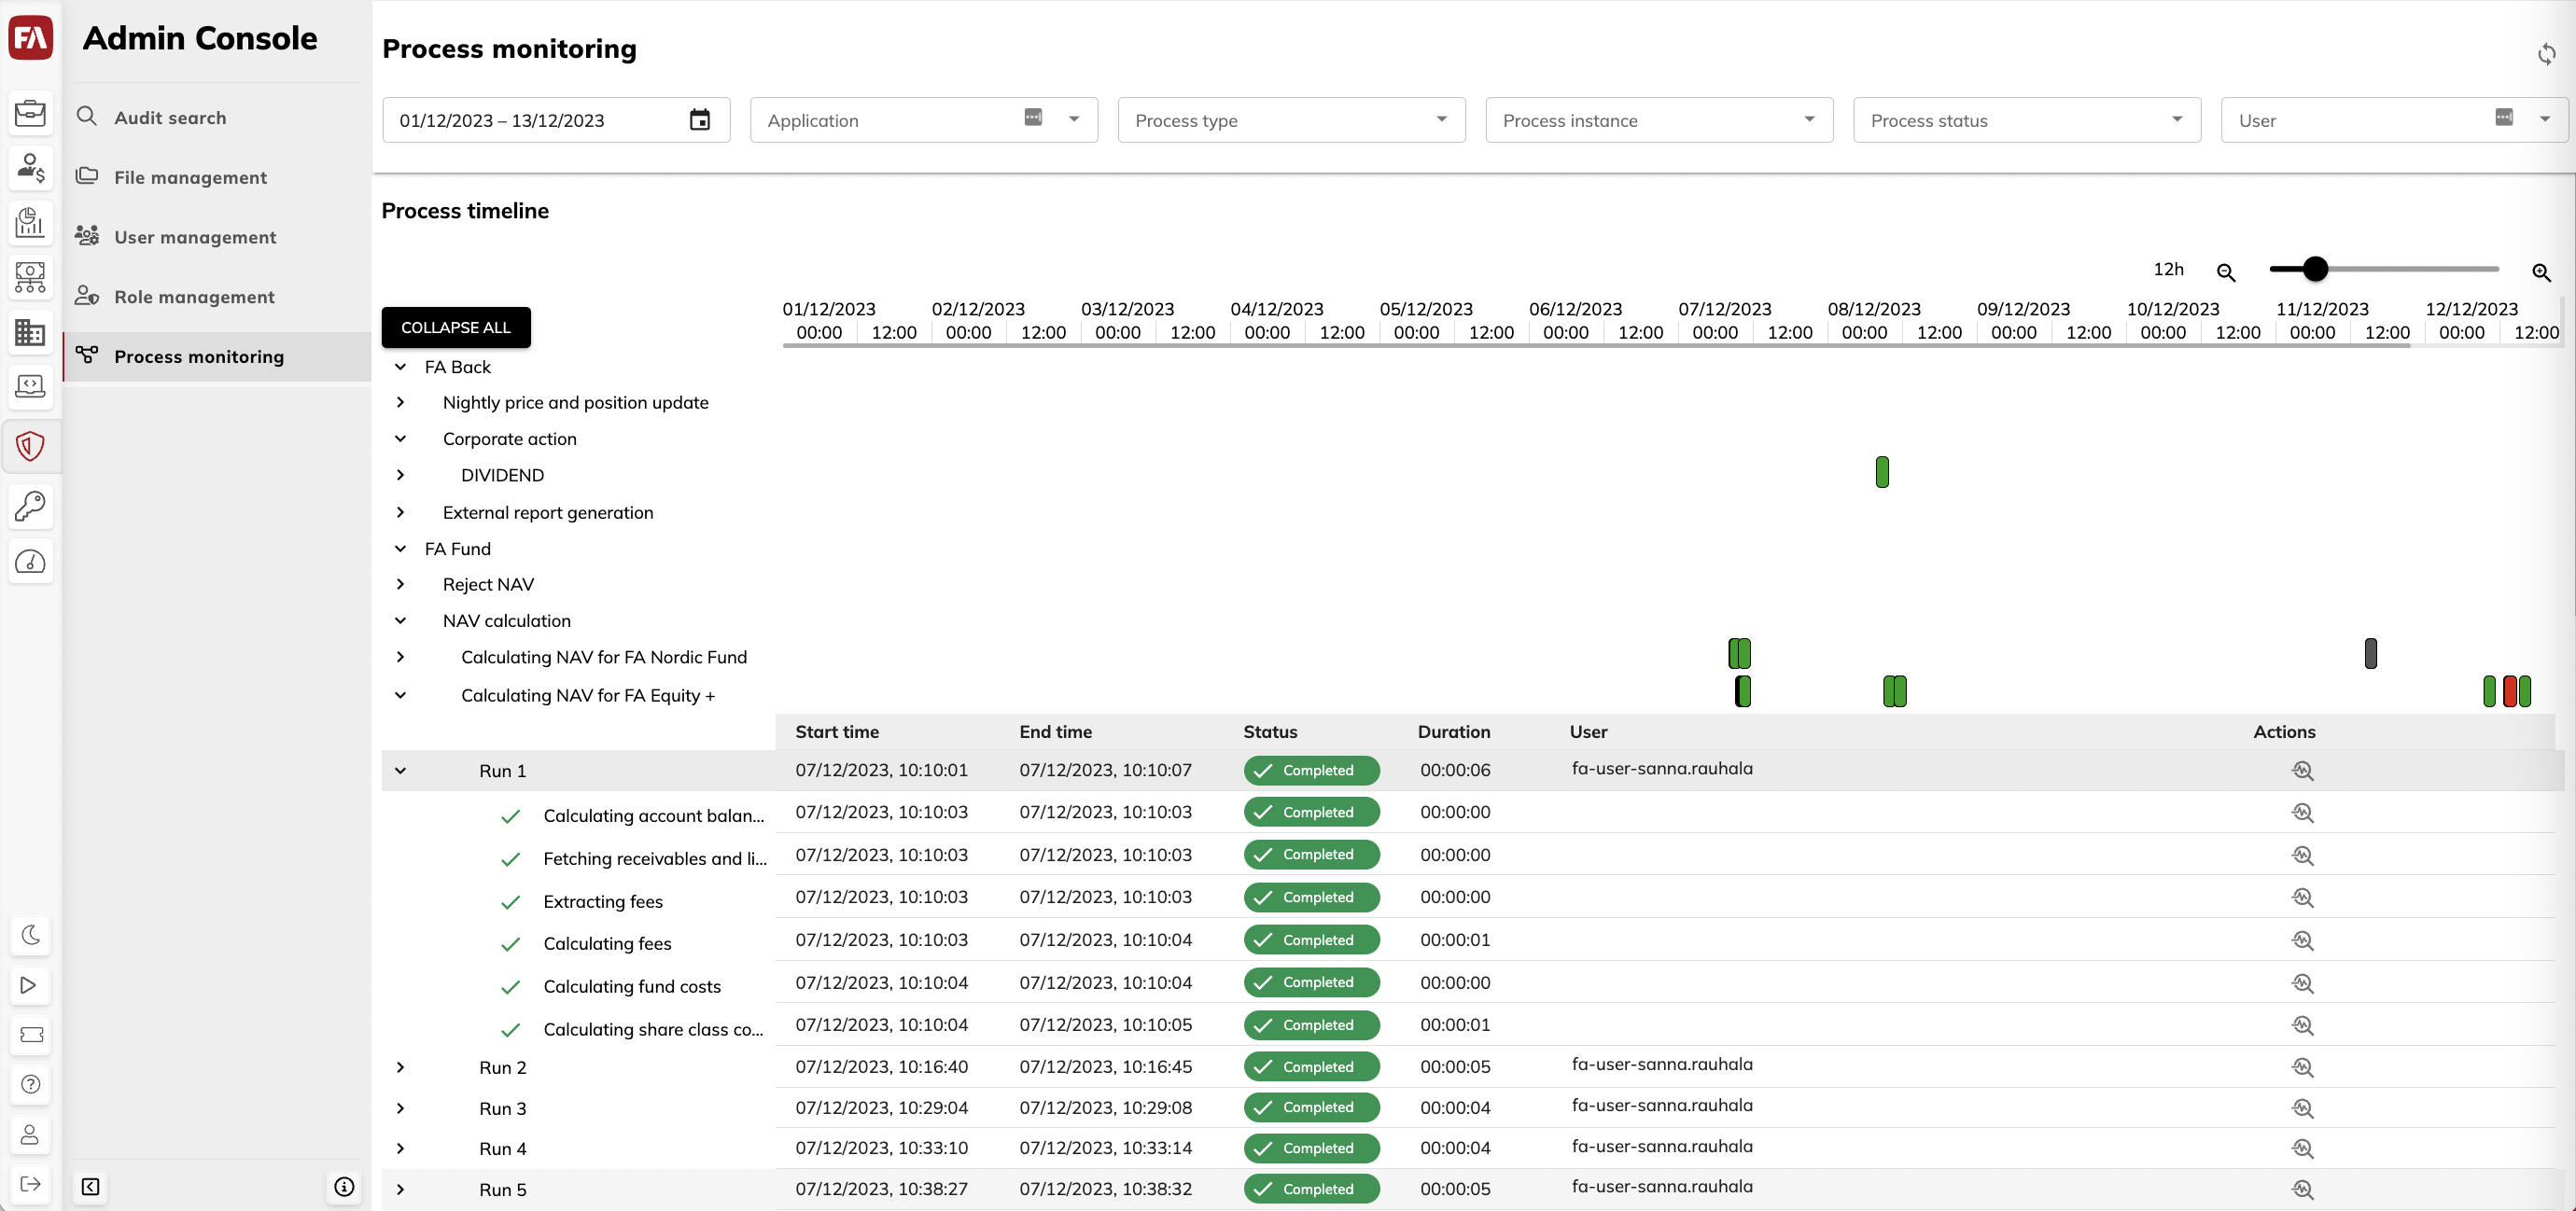
View the process timeline
In the Process monitoring view, you can see the timeline of process runs during a given period by choosing the start and end dates. To view information about a specific process, select the application it relates to. You can filter the list down by selecting a single process type, instance, or status. You can also adjust the time scale of the process timeline by using the slider on the right.
The status of a process run can be ongoing (blue), completed (green), canceled (grey), or error (red). Click on the process to view its information: start and end times of a run, its completion status, duration, and the user who executed it. You can expand the process run to see the stages.
 |
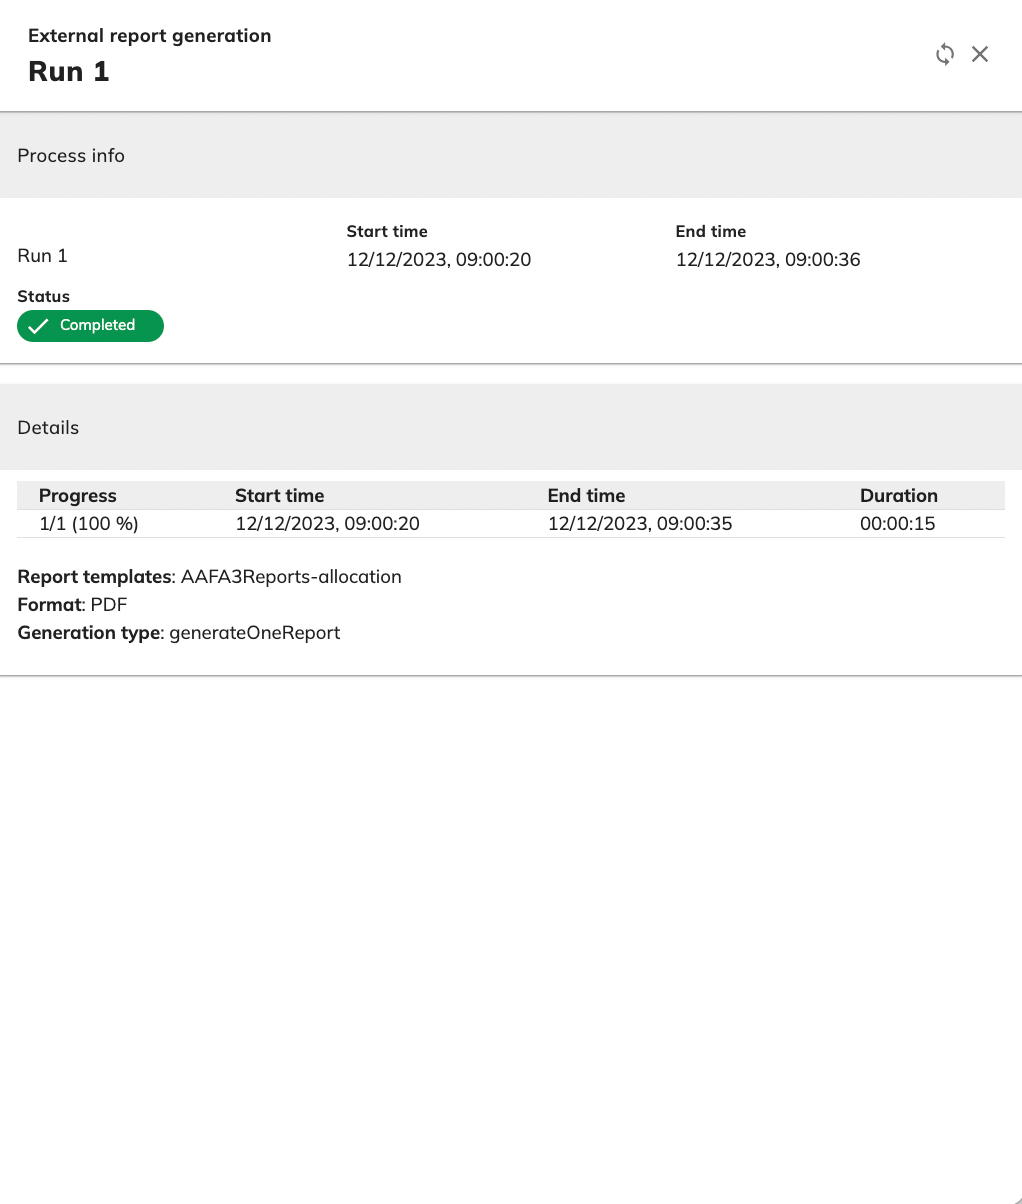
View process details
To view the details of a process run or stage, click  in the Actions column. The details shown depend on the process. For example, for the NAV acceptance process, you can see the date on which the NAV was accepted. If the run failed, you can view the error message. If the process was canceled, the details show the user who canceled it.
 |
Process information
The following information is available in the Process monitoring view:
- Start time
The start date and time of the run.
- End time
The end date and time of the run.
- Status
The run status. If the run was successful, the status is "Completed". If the run was canceled by a user, the status is "Canceled". If the run was unsuccessful, the status is "Error". If the run has not finished yet, the status is "Ongoing".
- Duration
The duration of the run in minutes, seconds, and milliseconds.
- User
The username of the user who executed the run.
- Actions
The Actions column shows the
button to open process run or stage details.- Canceled by
If the run was canceled, the username of the user who canceled it.