Analyze a portfolio in Strategy analyzer
Make sure, that you have set up your portfolios correctly to be used in strategy analyzer: Set up a portfolio to be ready for analysis in Strategy Analyzer
Selecting a portfolio for analysis
You can analyze individual portfolio in the Strategy Analyzer.
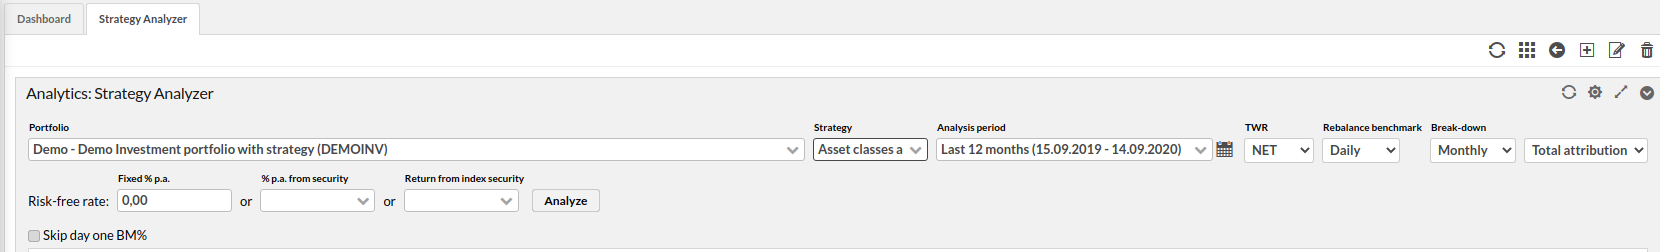 |
Choose a portfolio that has properly defined strategy as a Portfolio in Strategy Analyzer: <your portfolio>
If the portfolio has multiple strategies over different groups, choose the group to be analyzed: <strategy group>
If portfolio has only one strategy defined, you can leave this blank
Choose analysis period: Last 12 months
Choose TWR: NET
Net TWR = TWR after costs
Gross TWR = TWR before costs
Choose rebalance frequency: Daily
How frequently the bechmark is assumed to be rebalanced (weights returned to the target): none, daily, weekly, monthly, yearly
Click: Analyze
Viewing analysis results
Analysis
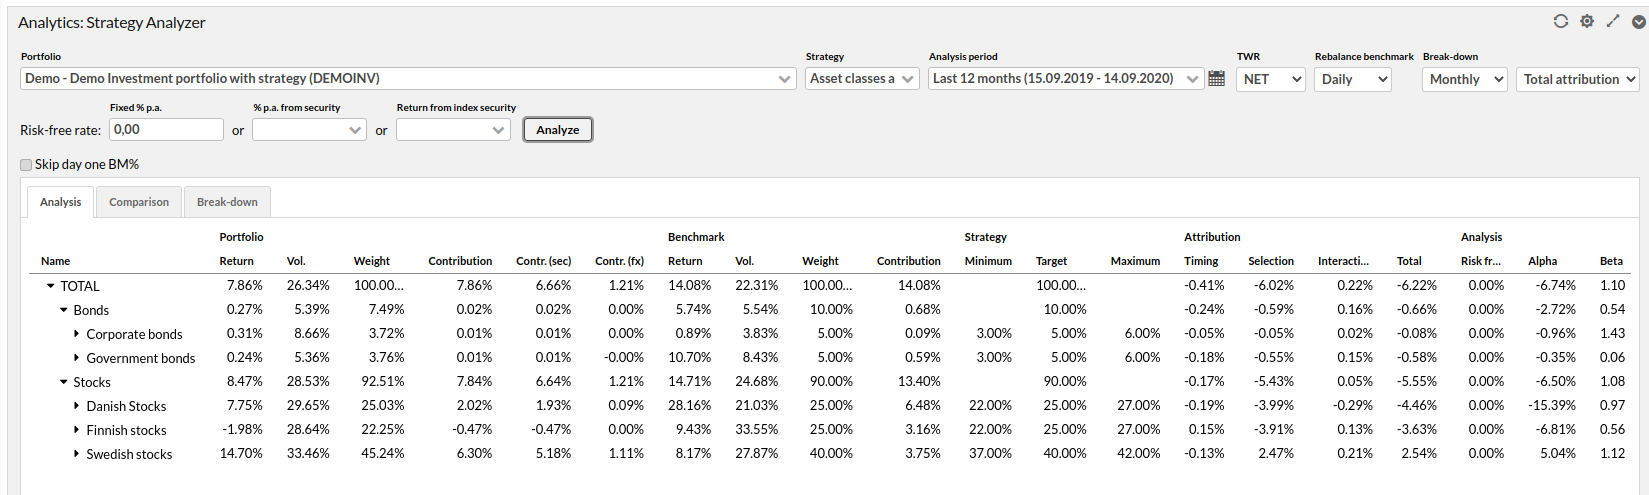 |
From the analysis, you can see how your portfolio has performed overall (Portfolio section) and compare it against how the selected benchmarks have performed (Benchmark section). Along with absolute return and volatility, you can also see how individual positions have contributed to the overall performance. Here you can see that Swedish stocks contributed most to the portfolio’s overall 7.86% return over the analysis period. Benchmark performed better overall with 14.08% return.
The Strategy section describes the underlying strategy weights. Here you can see that Swedish stocks had on average 45% share of the portfolio while the target was 40%.
The Attribution section then shows the results from the Brinson attribution analysis describing how allocation decisions (Timing), security selections (Selection) have contributed to the overall Attribution (different between the contribution of benchmark vs the position). Even though, the portfolio under-performed against its benchmark, the Swedish stocks were an exception (total attribution +2.54%). It was especially the selected stocks that had the positive effect on the attribution (+2.47%).
Analysis section contains some KPIs from comparing the position’s performance against the benchmark performance with optionally taking a risk-free rate into account.
Comparing of total attribution over time
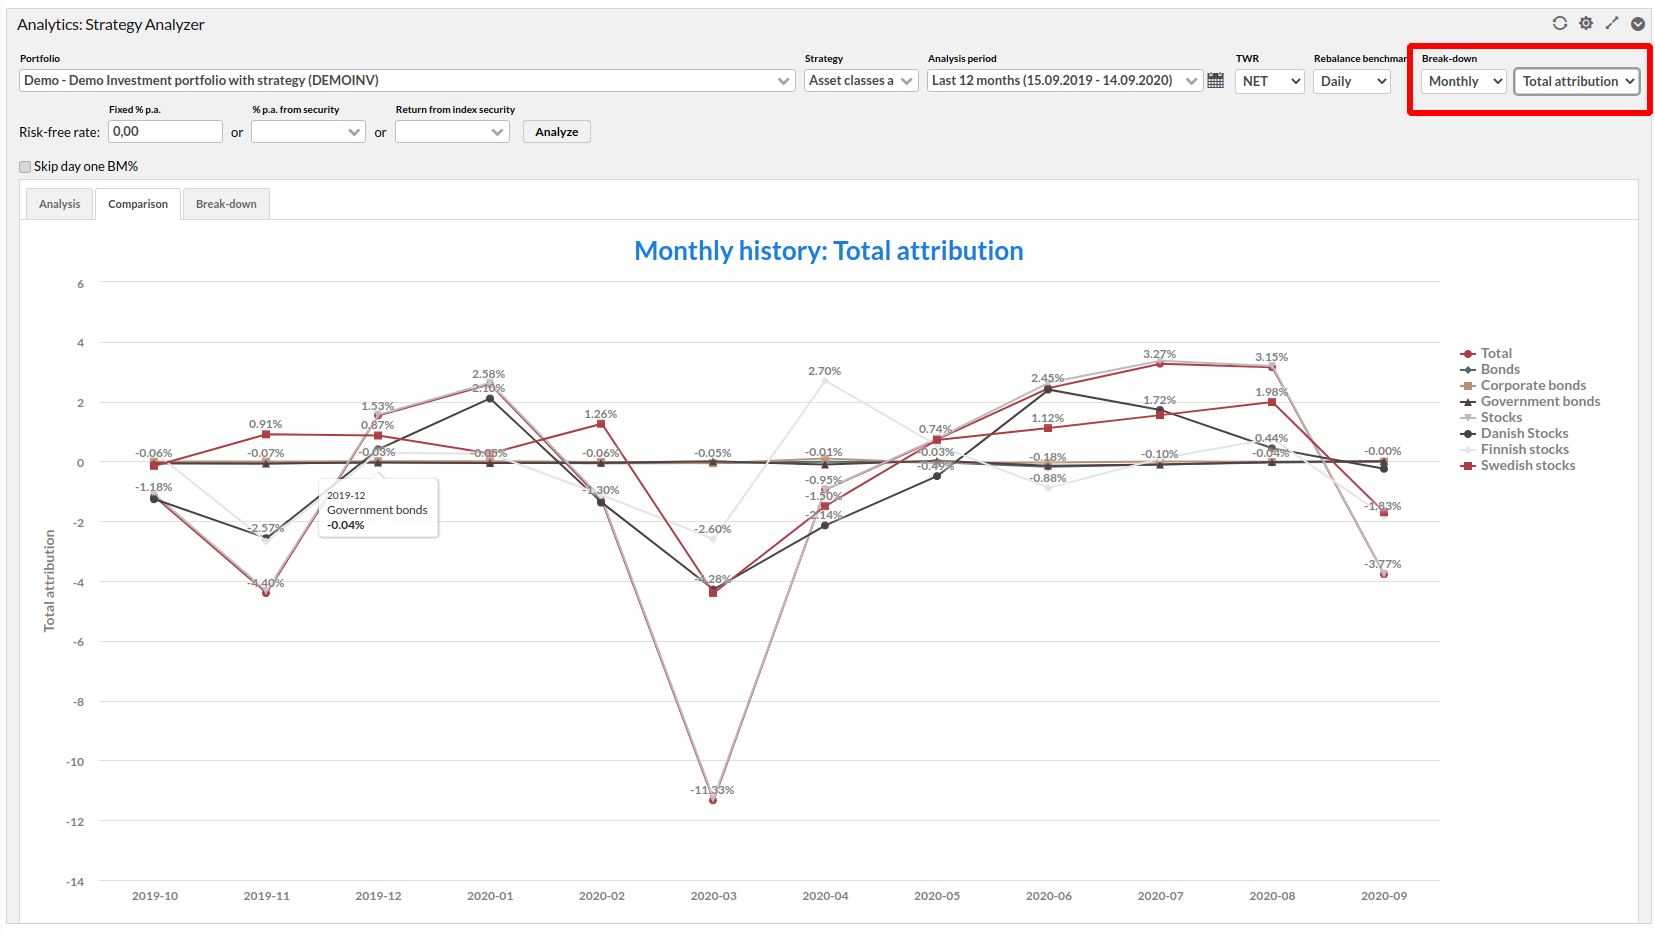 |
In order to see better, where the total attribution is coming from, you can choose compare individual asset classes and types’s total attribution month-by-month.
Identifying over/under weight periods (tactics)
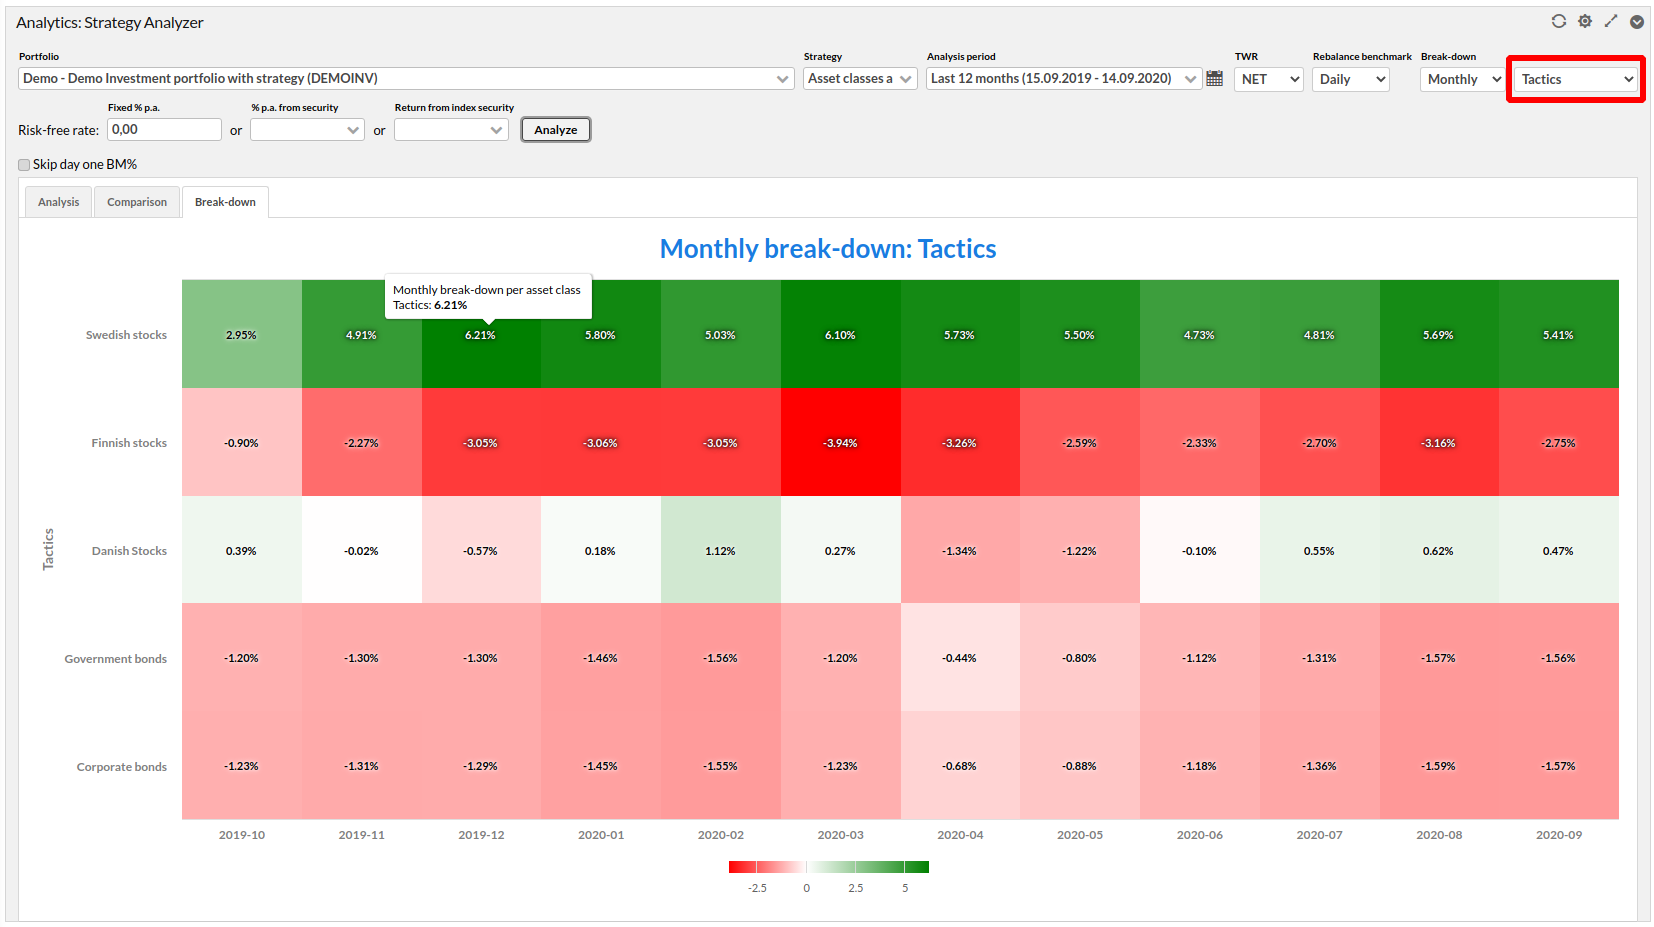 |
Break-down section uses a heat-map to indicate with color extreme values. Analysing “Tactics” identifying month-by-month and per asset type, which periods / positions were above or below there target shares. Here you can see, that over the analysis period, Swedish stocks were over-weighted while Finnish stocks were under-weighted.