Report calculation view
The Report calculation view shows statistics related to the throughput and speed of report calculation. It can help with diagnosing performance issues.
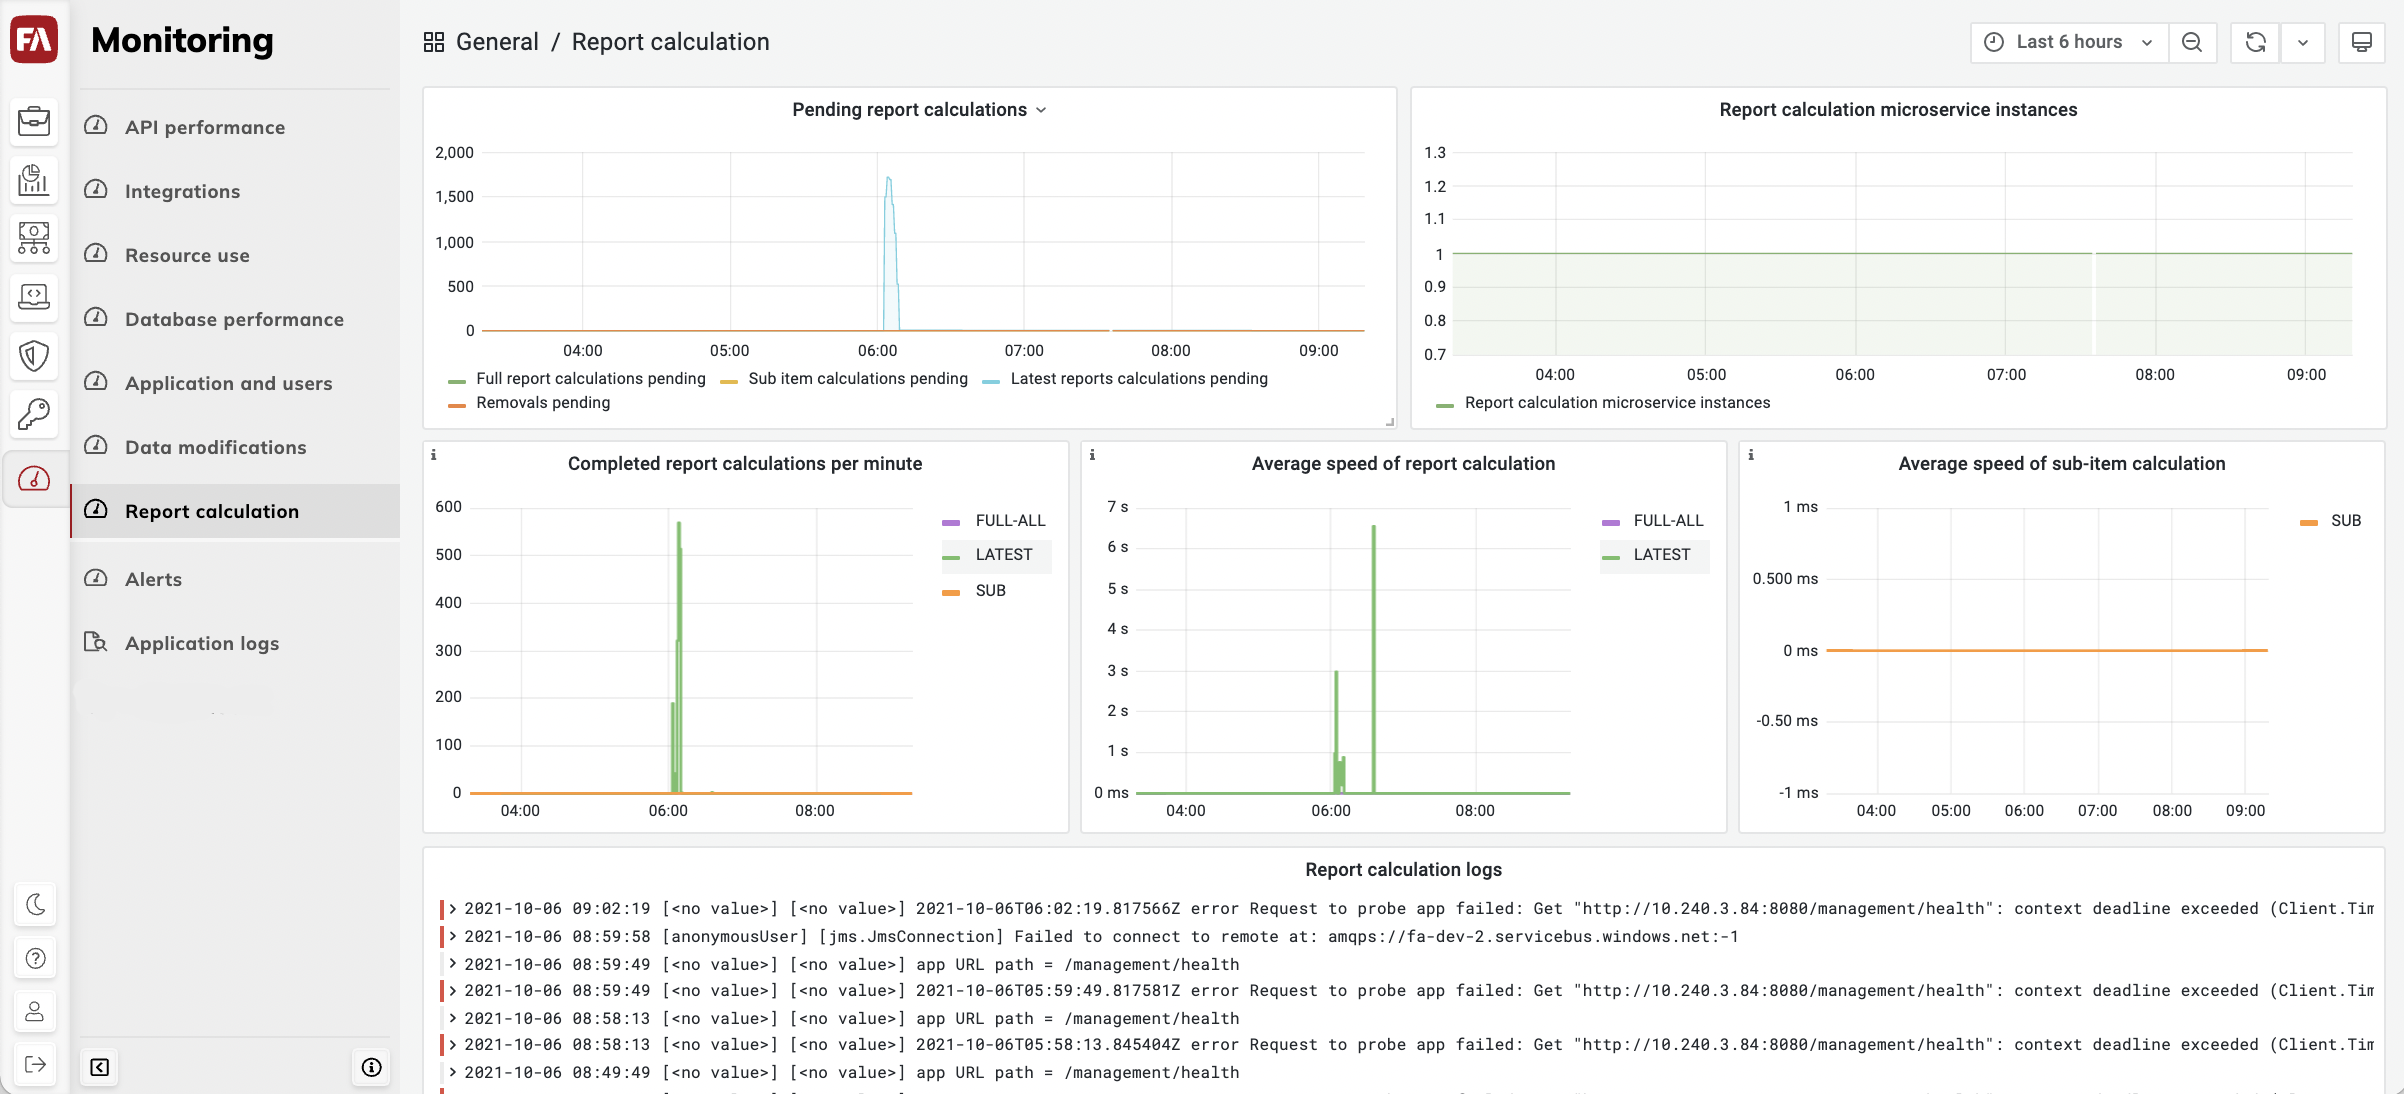
- Pending report calculations
The number of report calculation jobs by type waiting in line at a given point in time.
The chart corresponds to the data shown when you click Update → Show status of ongoing recalculations in FA Back, except that the chart shows the values over time.
The data for this metric is collected once a minute, so small or fast report calculations are likely not to show up in this chart. In case of large report calculation jobs, the chart shows you how much work remains to be done.
- Report calculation microservice instances
The number of report calculation microservice instances that are up and running. The number of report calculation microservice instances is also available in the Number of active application instances chart.
- Completed report calculations per minute
The number of report calculation jobs completed per minute. The lines show calculation type:
Full-all – Full recalculation of a portfolio’s entire history.
Latest – Calculation of the latest data only.
Error: Latest – Latest calculations with an error.
Due to technical reasons, this metric isn't always fully accurate especially with smaller numbers, but close to it. Spikes on this chart indicate extensive data modification taking place. It isn't directly indicative of performance.
- Average speed of report calculation
The average calculation time for different report types, during 1-minute windows. The lines show calculation type:
Full-all – Full recalculation of a portfolio’s entire history.
Latest – Calculation of the latest data only.
Errors: Latest – Latest calculations with an error.
Spikes on this chart may indicate a performance problem, as well as the processing of a particularly large portfolio. See the Report calculation logs to identify which case you deal with.
- Average speed of sub-item calculation
The average calculation time for the report sub-items, during 1-minute windows.
- Report calculation logs
The report calculation microservice logs that help investigate report calculation issues you see on the charts. For example, logs may show errors that happened at a certain time, or the portfolios that were calculated at that time.
.