Database performance view
The Database performance view shows aggregated statistics related to database activity and performance. The database stores the data, including contacts, portfolios, transactions, trade orders, and so on. InnoDB is a storage engine that loads and writes the data.
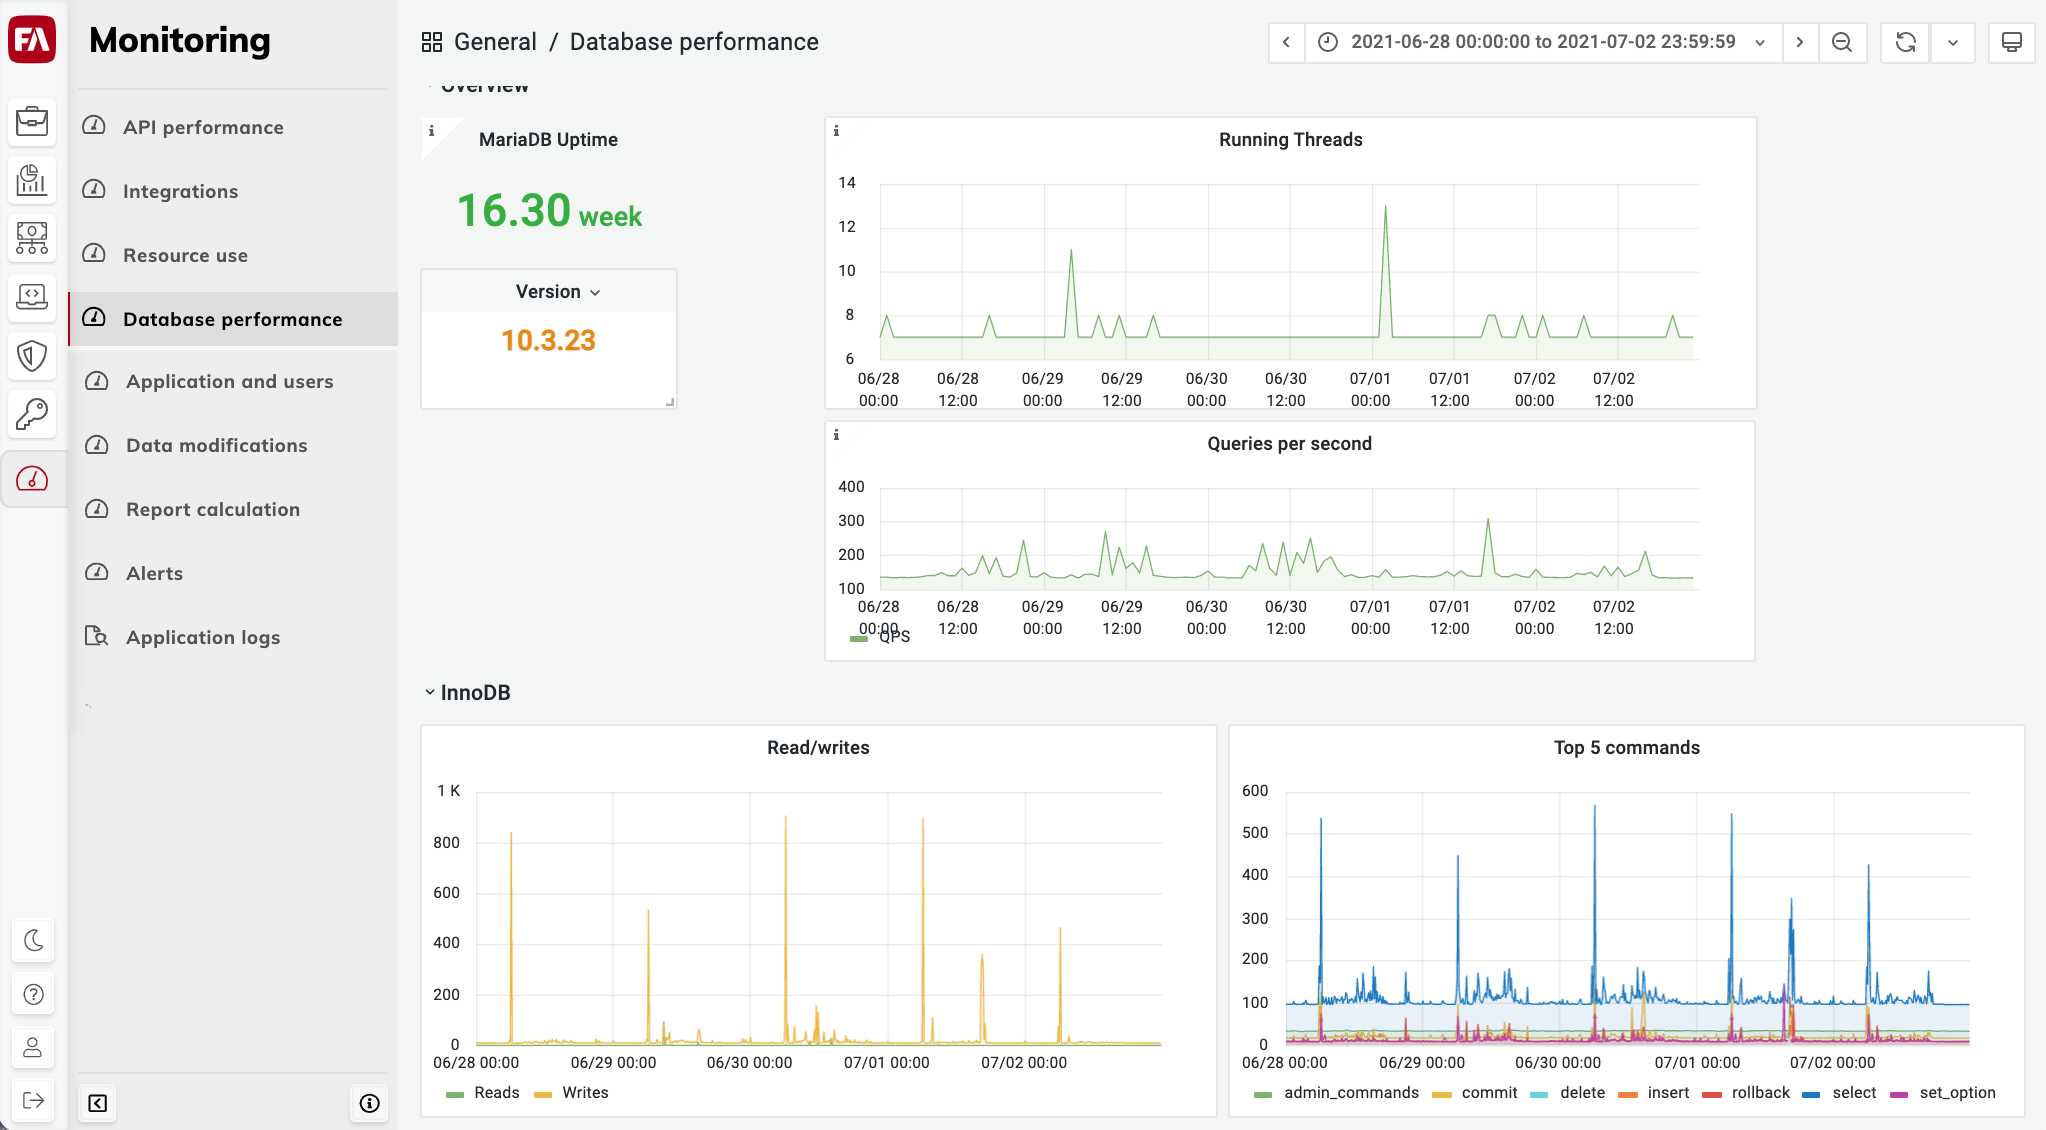
Overview
- Database Uptime
The amount of time since the last restart of the database server process.
- Running Threads
The number of active database connection threads. This is made up from the number of active external database connections plus the number of internal worker threads.
- Queries per second
The number of queries per second. This metric is indicative of overall database activity, but not all queries are the same: some queries are much faster than others. So to evaluate overall database load, combine this panel with the Network usage chart.
InnoDB
- Read/writes
The number of database reads and writes per second.
- Top 5 commands
Top 5 activities by number of command at different points in time. This chart indicates the predominant activity in the database at a given point in time. You can see if a lot of new data was inserted, or if a lot of existing data was updated, deleted, or selected (read), and so on.
Network
- Network traffic
The volume of network traffic generated by the database as a percentage of inbound and outbound network traffic. Outbound traffic is caused by reading data from the database. Inbound traffic is caused by writing data to the database.
- Network usage
The volume of network traffic generated by the database in absolute values per rolling 5-minute intervals.
Temporary objects and slow queries
- Temporary objects
The number of temporary objects used in the database operations.
- Slow queries
The number of queries that take longer than 10 seconds.
Select types and sorts
- Select types
The number of select operations that use table scanning, per second by type. Scanning operations are potentially suboptimal compared to index-based operations. The chart shows the following select types:
Select Scan – Queries that cause full table scans, in which all table data is read and either discarded or returned.
Select Range – Queries that use range scan reading all rows in a given range.
Select Full Join – Joins that are not joined on an index. This is usually a big performance hit.
- Sorts
The number of sort operations that use table scanning, per second per type. Due to a query's structure, order, or other requirements, the database sorts rows before returning them. For example, if a table is ordered 1 to 10 but you want the results reversed, the database sorts the rows to return 10 to 1. Scanning operations are potentially suboptimal compared to index-based operations. You can track when sorts had to scan the whole table or a given range of a table to return the results.