Application logs view
The application logs view allows you to browse and search for system logs of FA platform apps.
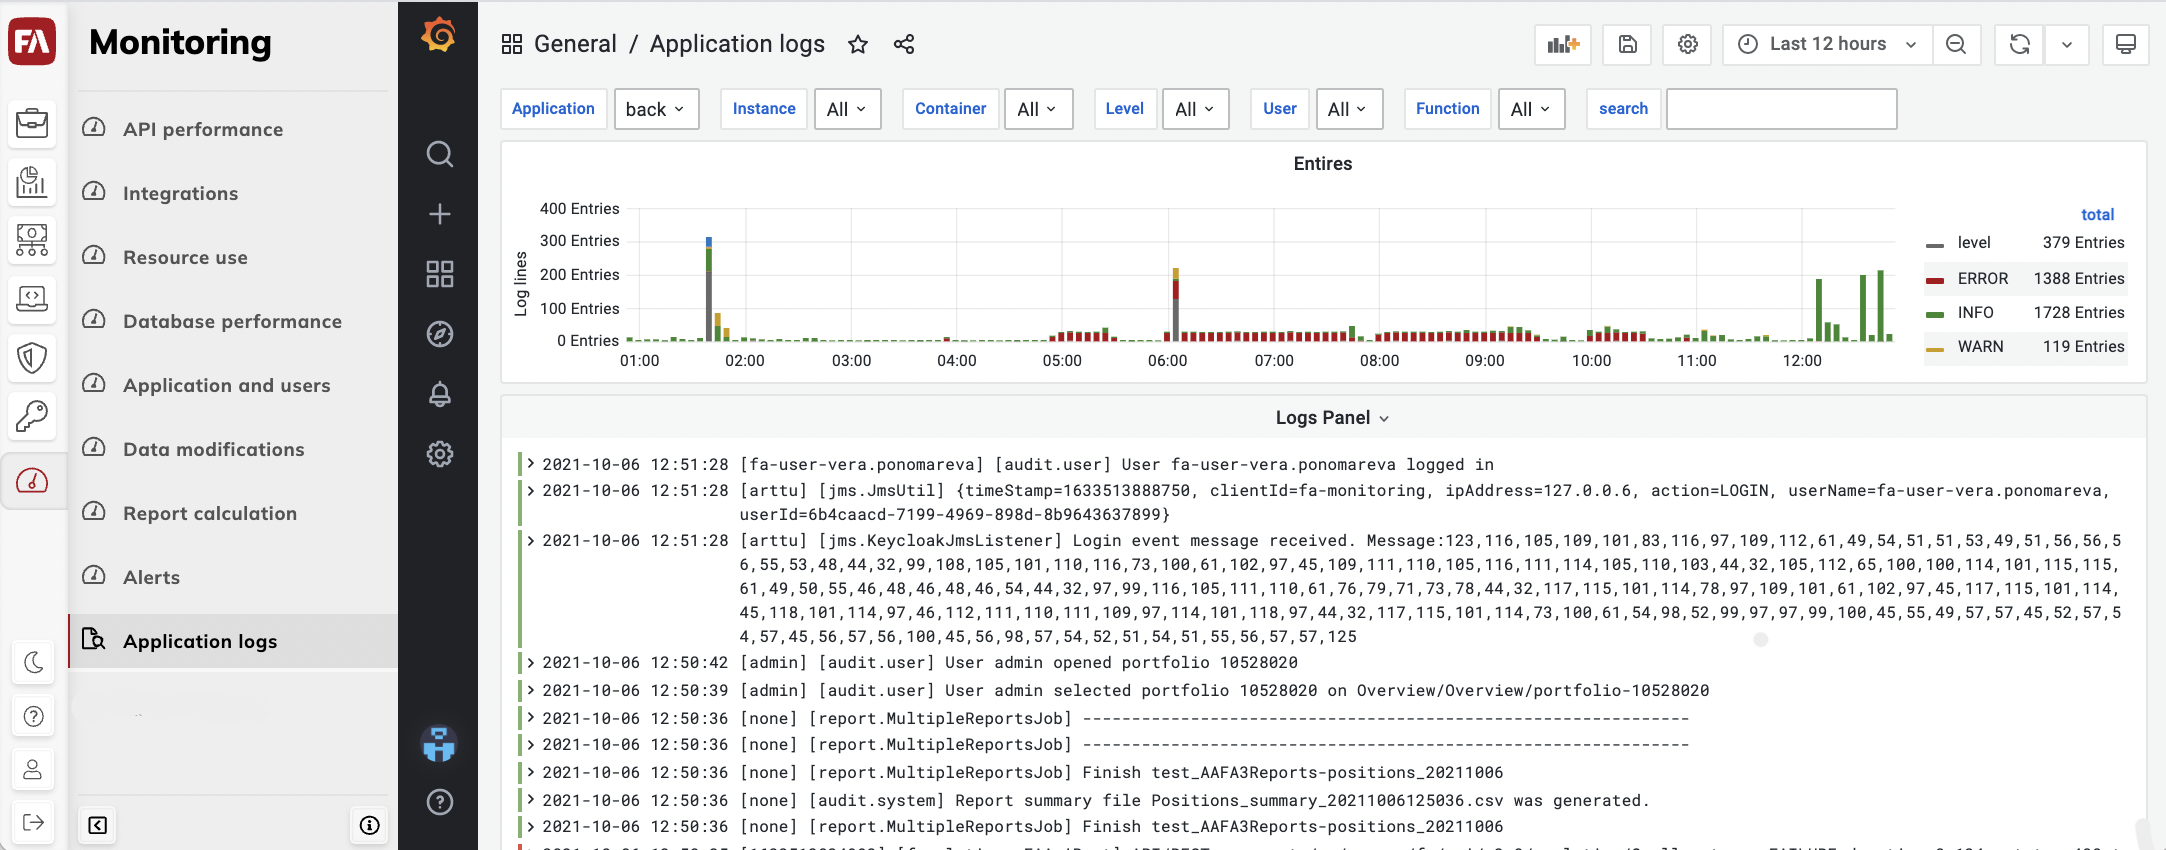
- Entries
The number of log entries over time, broken down by log levels:
debug – Detailed log information, enabled only when investigating specific problems.
info – Logs about events of interest.
warning – Logs that indicate a possible issue in the system.
error – Logs that indicate a likely error in the system.
- Log panel
Log entries for the selected time period.
Filters
Filters at the top let you choose logs to view:
- Application
The application/ microservice to view the logs for.
- Instance
The app instance to view the logs for, if you have multiple instances running.
- Container
The part of the deployment package of an application or microservice. This filter is rarely used, you should usually choose the Application filter instead.
- Level
The log levels to view, for example, you can choose to show warn and error logs, and filter out the rest. This is very useful when looking for errors in applications that write logs very actively. Note that some log entries may not have a log level at all. Such logs aren’t shown if you apply this filter.
- User
The username of the user whose actions produced the logs.
- Function
The part of the app that produced the logs, for example, “audit.system” and “audit.user”. Note, that the full audit log content is not available in this dashboard; audit logs contain several parts, of which only the message part is shown here.