Key figures as columns on search views
Key figures you have stored under your contacts, portfolios and securities are also available as selectable columns on the corresponding search views. This allows you to easily see the latest key figure values you have stored, and flexibly search for your contacts, portfolios and securities with the key figure values. For example, if you are storing the credit rating as a security key figure, you can see the latest credit rating on the Securities view, and search for securities with a specific credit rating. (Available from FA 3.5 onward)
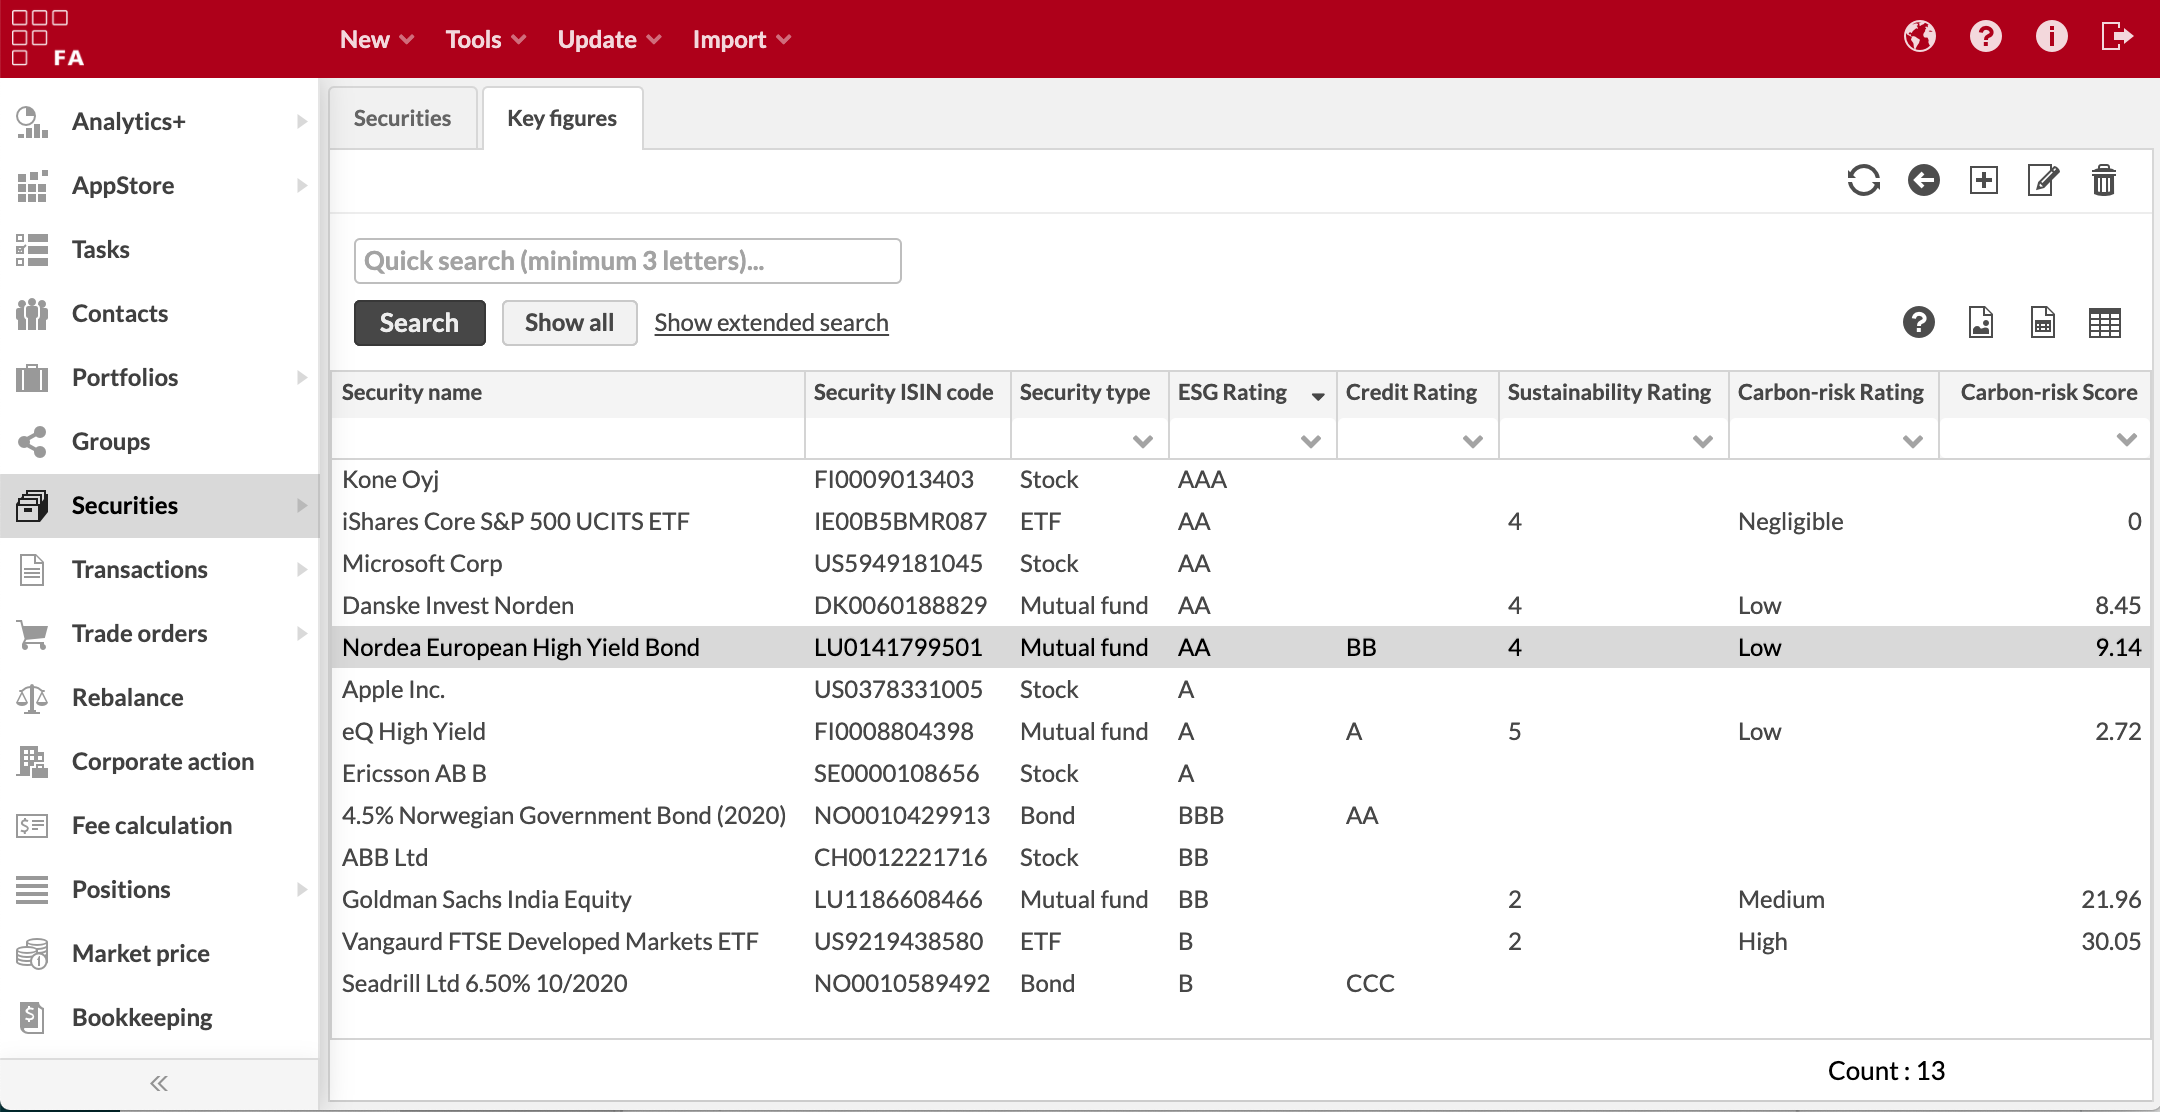
Columns based on key figures are automatically available on corresponding search views after you have added the key figure in Preferences, allowing you to select them as columns. The key figure columns always show the latest available key figure value - for example, if you have added a history of "ESG Ratings", the column's content will show the latest / newest available value.
Columns based on key figures allow you to filter the content with an appropriate filter in order to search for your contacts, portfolios and securities with key figure values. For example, if you have stored numbers in your key figure, you can filter with a number filter, and if you select your key figure value from a category, you can also filter by selecting a category from a dropdown.
Security key figures as columns in Analytics+
You can configure new columns into Analytics+ based on key figures you have stored under your securities. For example, you can show average ratings or financials of your underlying investment to thoroughly analyze your investments. (Available from FA 3.5 onward)
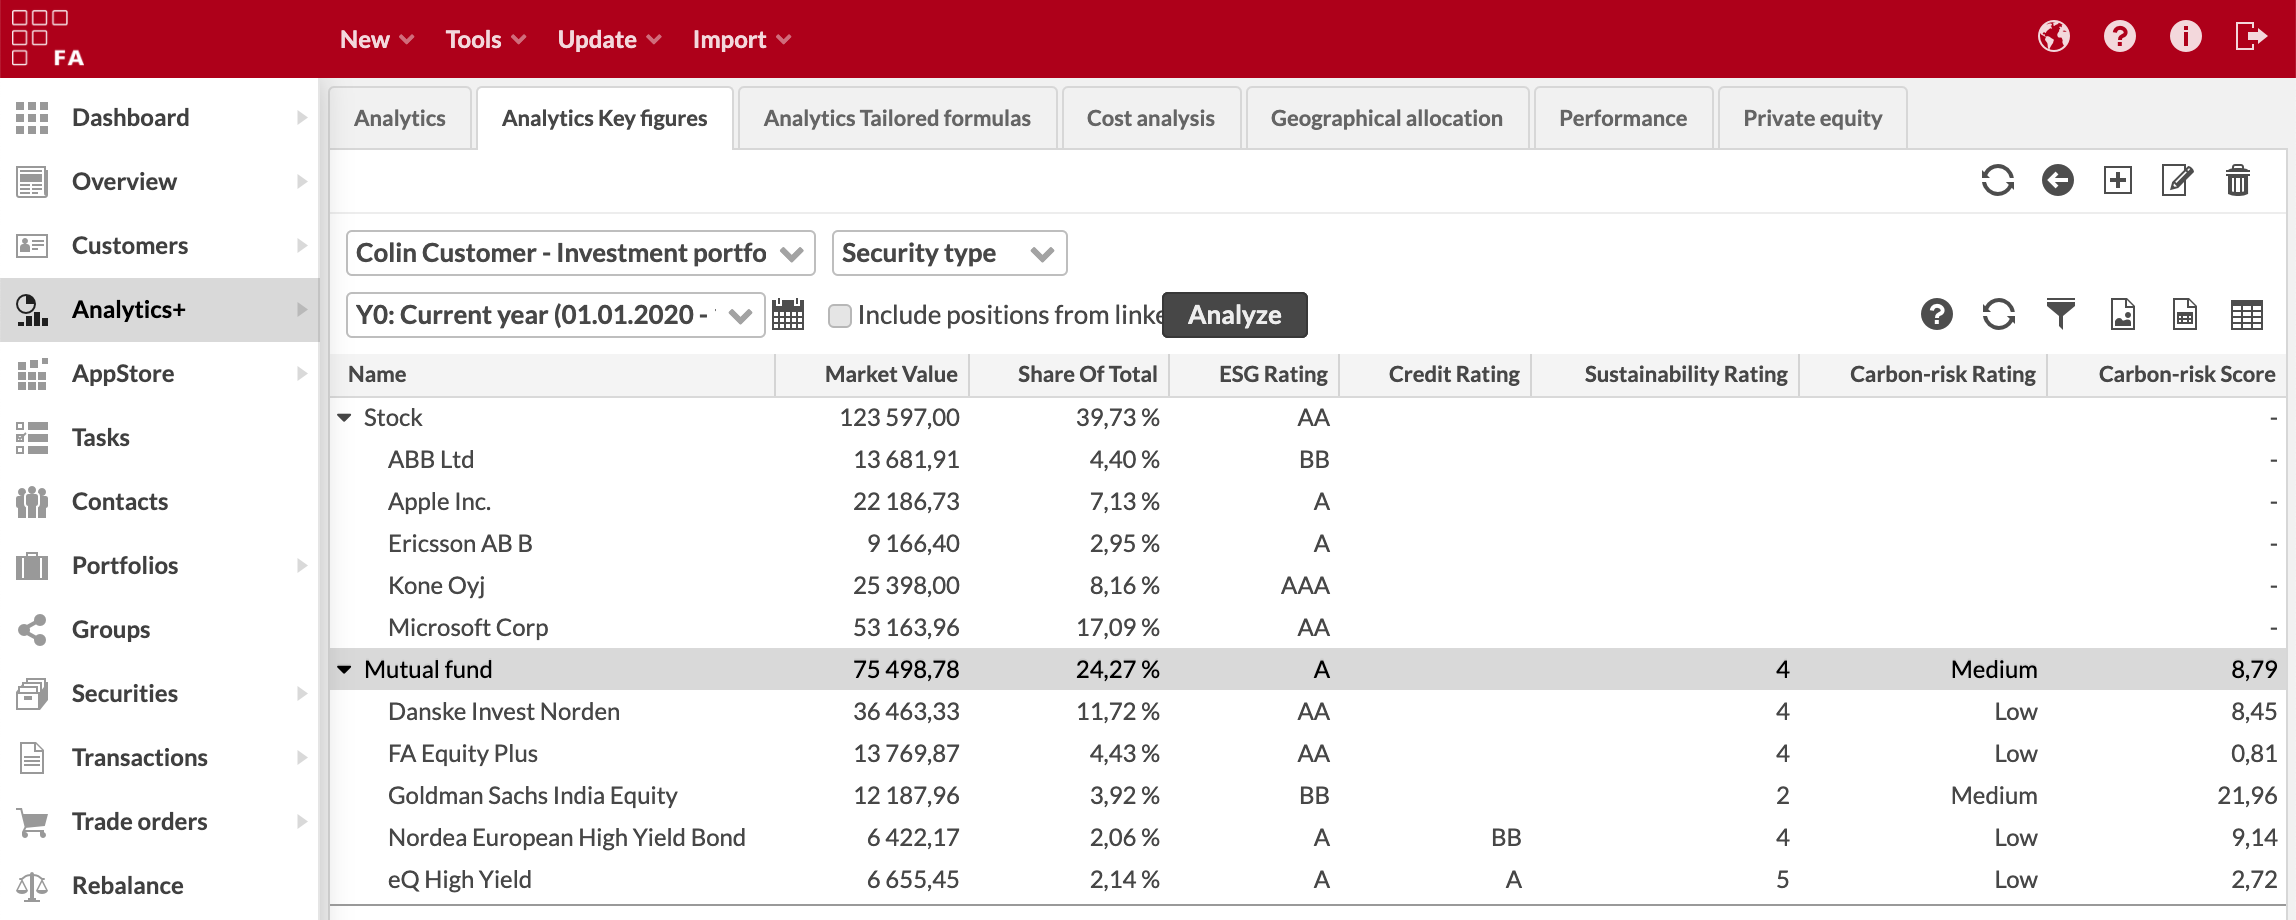
Whereas key figures appear as columns on the corresponding search views as soon as you add the key figure, if you want to use a security key figure in Analytics+, you need to separately enable it. This is because you need to decide whether and how you want to calculate values on group levels (direct sum, weighted average, etc.) and how you want to round group level values (half up, always up, or always down). Some key figures don't make sense when calculated on a group (e.g. security type) level, and for example a conservative take on risk measures might lead you to always round up - these decisions cannot be determined automatically based on the key figure definition.
You can manage Analytics + columns under Content and translations Preferences. Columns based on key figures are easy to add: just define a name for your column, select which key figure you want to use, and configure how group level values are calculated (such as calculating security type level rating with weighted average, rounding down to the nearest rating). See Configuring Analytics columns in Preferences for more details.